


Fertility Market Size, Key Companies, Company Product Portfolio, Hospital Procurement Trends, Manufacturing Capacity, Sales Performance, Regulatory Approvals, Company Market Share, and Forecast
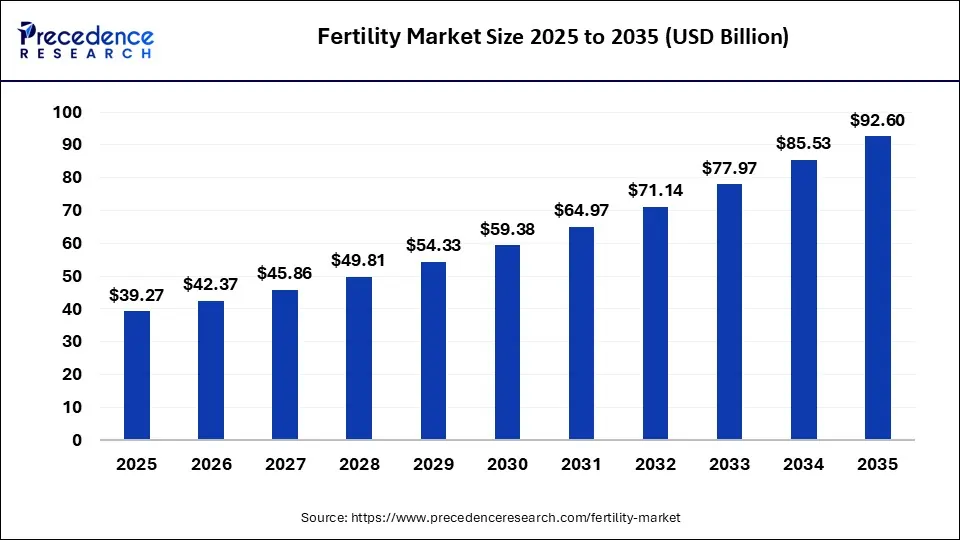
The global fertility market is projected to grow from USD 42.37 billion in 2026 and is projected to reach USD 92.60 billion by 2035, growing at a CAGR of XX% during the 2026-2035 forecast period. Growth is driven by rising infertility rates, delayed parenthood, wider adoption of assisted reproductive technologies, AI-enabled fertility care and growing fertility treatment awareness. The report analyzes the market by product and service, end user and region, covering ART, fertility drugs and diagnostics, pricing and cost per outcome, reimbursement, competitive positioning, strategic developments and high-value growth opportunities for clinics, technology suppliers, pharmaceutical companies, benefits providers and investors.
Source: https://www.precedenceresearch.com/fertility-market
 Get a Sample
 Table Of Content


Fertility Market Size and Forecast 2026 to 2035
The global fertility market is projected to grow from USD 42.37 billion in 2026 to USD 92.60 billion by 2035, registering a CAGR of 8.96%. Growth is driven by rising infertility rates, delayed parenthood, increasing adoption of assisted reproductive technologies (ART), advancements in AI-enabled fertility care, and growing awareness of fertility treatments. Europe dominates the market due to its well-established fertility clinics and supportive healthcare infrastructure, while Asia Pacific is expected to witness the fastest growth, supported by increasing infertility awareness, expanding access to ART, favorable government initiatives, and improving healthcare infrastructure.
Key Takeaways
- Assisted reproductive technology (ART) accounted for 71% of the global fertility market revenue in 2026, making it the leading procedure category.
- Fertility clinics represented 65.6% of the market by end-user share, supported by specialized treatment facilities and embryology laboratory capabilities.
- Europe held the largest regional market share at 33.3% in 2026, driven by established fertility treatment infrastructure and reimbursement frameworks in several countries.
- Asia Pacific is expected to record the fastest regional growth from 2026 to 2035, supported by expanding clinic networks, rising awareness, and improving healthcare access.
- The average cost of a single IVF cycle in the United States is approximately USD 12,400, although treatment costs vary by clinic and procedure.
- IVF live-birth rates are approximately 32.2% for women under 35, compared with as low as 1.9% for women over 44, highlighting the influence of maternal age on treatment outcomes.
- The U.S. fertility market includes employer-sponsored benefits platforms such as Progyny, which influence treatment access through employer relationships and coverage programs.
- India's fertility market features expanding clinic networks, including Indira IVF and Nova IVF Fertility, as providers seek to address unmet demand and improve access to ART.
- Fertility market competition spans three major business tiers: clinic networks, pharmaceutical and biotechnology suppliers, and ART laboratory technology and consumables providers.
Sustained Double-Digit-Adjacent Growth Through the Next Decade
Growth is driven by rising infertility rates, delayed parenthood, increasing adoption of assisted reproductive technologies (ART), advancements in AI-enabled fertility care, and growing awareness of fertility treatments. Europe dominates the market due to its well-established fertility clinics and supportive healthcare infrastructure, while Asia Pacific is expected to witness the fastest growth, supported by increasing infertility awareness, expanding access to ART, favorable government initiatives, and improving healthcare infrastructure.
Key Coverage
- Regional and sub-segment CAGR comparison
- Incremental value opportunity quantification
- Cross-validation against ART/IVF-specific market estimates
Segmental Analysis
The global fertility market remains concentrated in assisted reproductive technology (ART), which accounted for 71% of market revenue in 2025, while fertility clinics represented 65.6% of the market by end-user. These shares reflect the economics of laboratory-intensive procedures, specialized embryology capabilities, and the operational advantages of dedicated treatment centers. ART benefits from demand for in vitro fertilization (IVF) and intracytoplasmic sperm injection (ICSI), alongside continued advances in embryo culture, cryopreservation, time-lapse imaging, and genetic screening. Fertility drugs, by contrast, are projected to grow at a CAGR of XX%, indicating a more mature market in which medications increasingly support ART cycles rather than independently drive revenue.
Our analysis indicates that the market's largest revenue pools are not necessarily its fastest-growing opportunities. Fertility diagnostics remain strategically important because hormonal testing, semen analysis, ovarian reserve assessment, and imaging determine subsequent treatment pathways, even though their direct revenue contribution is smaller than that of ART. Similarly, hospitals are projected to grow at a CAGR outpacing the slower-growing fertility drug segment. Our assessment is that hospital-based expansion reflects increasing integration of fertility services into broader reproductive healthcare, while dedicated clinics retain advantages in specialized laboratory operations and treatment delivery. The commercial implication is that providers must balance the efficiency of focused fertility centers with the referral networks, integrated services, and potential reimbursement advantages of hospital systems.
Regionally, Europe held the largest market share in 2025 at XX%, supported by established treatment infrastructure and reimbursement frameworks in several countries. Asia Pacific is expected to record the fastest growth between 2026 and 2035, with a projected CAGR of XX%, driven by expanding clinic networks, rising disposable incomes, and unmet demand in China and India. North America remains a significant market, where employer-sponsored fertility benefits increasingly influence treatment access, while Latin America and the Middle East & Africa offer emerging opportunities subject to differences in affordability, infrastructure, and regulatory conditions. In our view, the most significant implication is that expansion strategies must reflect regional market maturity: established markets reward differentiation, treatment outcomes, and payer alignment, whereas developing markets offer opportunities to expand access and build clinical capacity.
The full report further quantifies market size, historical performance, forecasts, and growth contributions across procedure types, product/service categories, end-users, and regions. It examines the revenue concentration of ART, the evolving roles of diagnostics and fertility drugs, the competitive implications of clinic-versus-hospital delivery models, and the geographic factors shaping market accessibility and expansion. Where granular data are available, the analysis can also be structured into a segment-level dataset tracking category, end-user, region, market share, historical revenue, forecast revenue, and CAGR, with filtering and benchmarking capabilities to support comparisons across segments and geographies.
Key Coverage
- Share and growth-rate breakdown by procedure type (ART, drugs, diagnostics)
- Share and growth-rate breakdown by end-user (clinics vs. hospitals)
- Regional share and CAGR comparison
- Country-level sizing for key growth markets (India, China, U.S.)
Why Does the True Cost of an IVF Live Birth Run Multiples of the Headline Cycle Price?
The average cost of a single IVF cycle in the United States is estimated at approximately USD 12,400, with cycles using fresh embryos averaging around USD 8,158 and a reported median cost near USD 7,500. Costs vary substantially depending on clinic competition, regulatory environment, and the extent of public or insurance-based reimbursement. Against this pricing backdrop, IVF success rates average between 28% and 35% per cycle but decline sharply with maternal age: reported live-birth rates run around 32.2% for women under 35 versus as low as 1.9% for women over 44.
Our analysis indicates that the headline per-cycle price is a structurally misleading measure of what patients pay to achieve live birth. With average success rates well below 50% even in the most favorable age bracket, and falling to near-negligible levels past 44, a meaningful share of patients require two, three, or more cycles before a successful pregnancy, meaning the effective cost of an outcome is frequently a multiple of the quoted single-cycle price rather than a close approximation of it. We believe this gap between quoted and effective cost is the single most important pricing dynamic in the market, more consequential to patient behavior than headline cycle pricing itself, because it directly determines affordability, financing needs, and the point at which patients abandon treatment.
In our view, the most significant implication is that a competitive and commercial strategy in this market should be built around cost-per-outcome rather than cost-per-cycle. Clinics and technology suppliers that can credibly improve success rates, through better embryo selection, culture media, or genetic screening, are effectively lowering the patient's real cost of a live birth even if their per-cycle price is unchanged or higher, a distinction that matters increasingly as patients and payers become more sophisticated about comparing options. We expect this dynamic to continue driving demand toward multi-cycle financing products, refund or guarantee-based pricing packages, and employer-sponsored fertility benefits, since all three effectively convert an uncertain, potentially multi-cycle cost into a more predictable, manageable one for the patient. Our assessment indicates a clear opportunity for benefits platform providers and insurers to differentiate through outcome-based coverage models rather than simple per-cycle reimbursement caps. Such caps can leave patients under-covered when additional treatment cycles are most needed, limiting access to continued care.
The full report extends this analysis with country-level per-cycle pricing benchmarks, age-stratified success-rate curves by procedure type, and effective cost-per-live-birth modeling across major markets. It also provides a comparative assessment of how reimbursement structures, including public coverage, private insurance, and employer benefits, influence the number of treatment cycles patients typically pursue before achieving or discontinuing treatment.
This pricing and outcomes intelligence can also be structured into a queryable dataset that tracks cycle pricing, success rates, and reimbursement status by country, patient age band, and year. This enables clients to benchmark effective cost per outcome across markets, model the financial impact of different coverage designs, and identify where improvements in success rates could have the greatest impact on patient affordability. The dataset is designed to give clinical, commercial, and benefits-strategy teams a granular basis for pricing and coverage decisions that the narrative-level analysis above can only summarize.
Key Coverage
- Average and median per-cycle cost benchmarks
- Age-stratified success-rate data
- Effective cost-per-outcome analysis
- Regional cost variation and reimbursement landscape
How are Age, Coverage Access, and Fertility Preservation Reshaping Patient Treatment-Seeking Behavior and Demand Patterns in the Fertility Market?
Fertility treatment demand is strongly age-stratified, and the economics change sharply with each age band. IVF success rates average between 28% and 35% per cycle but fall from around 32.2% for women under 35 to as low as 1.9% for women over 44, against an average U.S. cycle cost of approximately USD 12,400 (median near USD 7,500). Younger patients are more likely to enter through diagnostic and lower-intervention pathways, while older patients are more likely to require ART directly because of lower spontaneous conception probability. Alongside this reactive, diagnosis-driven demand, a distinct pool has emerged around elective fertility preservation, particularly egg freezing among women in their late 20s to mid-30s who want to preserve options ahead of anticipated delayed childbearing.
Our analysis indicates that these are two economically different customer groups rather than one patient base at different life stages. Conventional infertility patients are typically reactive and time-pressured, and their decisions turn on clinic success-rate transparency, financing, and coverage terms. Patients who choose fertility preservation often plan ahead and pay directly for the service. As a result, clear pricing, transparent information on additional costs, and flexible payment options can play an important role in their decision-making. Because success rates decline steeply with age, we believe the timing of entry into care is becoming as commercially important as the choice of procedure, and it explains why the same market contains both urgent, high-intensity ART demand and early, lower-intensity planning demand.
In our view, the most significant implication is that clinic networks and technology suppliers will need differentiated propositions for each group rather than a single patient journey. Success-rate transparency, cost-per-outcome positioning, and flexible financing matter across both, but the pathway design differs diagnostics-led for younger patients, direct ART for older patients, and self-pay preservation programs for planners. From our assessment, this creates an opportunity for operators and employer-benefits platforms that can pair preservation offerings with coverage and financing options, since earlier engagement may also position a clinic to retain patients who later move into ART.
The full report quantifies patient volumes and procedure mix by age band, sizes the elective preservation segment, and assesses how success-rate transparency, price, financing, and employer or insurance coverage terms influence treatment initiation and clinic choice across major markets. Where sufficiently granular information is available, the same intelligence can also be structured into a dataset tracking patient age band, treatment pathway, procedure type, payment model (self-pay, insurance, or employer-sponsored), country, clinic type, and year. This enables users to filter and benchmark demand patterns across customer groups and markets, and to identify where preservation and ART demand are growing fastest alongside the strategic findings of the report.
Competitive Strength in Fertility Being Built Through Clinic Network Scale or Laboratory Technology Control?
The fertility market is not one competitive arena but three tiers with very different structures. Multi-site clinic networks compete on geographic reach, success-rate reputation, and patient experience, and the tier remains fragmented globally, with no single operator holding more than a low single-digit share of treatment volume. Pharmaceutical and biotechnology companies supply fertility drugs and hormonal therapies. Specialized laboratory-technology and consumables suppliers provide the reagents, culture media, cryopreservation systems, and capital equipment that underpin ART, and this tier is more concentrated among a smaller set of global suppliers. These tiers sit on top of a value pool where ART accounts for roughly 71% of market revenue and fertility clinics for 65.6% of end-user share.
Our analysis indicates that fragmentation in clinical delivery is a regional rather than a structural condition. Individual national markets such as Australia, the UK, and India already show meaningful consolidation around a small number of dominant networks, which suggests that scale advantages emerge locally, through density, referral relationships, and brand reputation, before they emerge globally. By contrast, the technology tier derives its position from proprietary formulations and installed equipment that every ART clinic depends on, giving suppliers influence across the whole procedure base without direct exposure to clinical services. Our assessment is that this creates two distinct sources of durable advantage: local clinic scale and success-rate reputation on one side, and embedded technology and consumables supply on the other.
In our view, the most significant implication is that consolidation will continue to follow the logic of each tier rather than converge on a single global leader. Clinic operators are likely to keep expanding through regional bolt-on acquisitions, while technology suppliers are more likely to broaden laboratory-product portfolios and move toward integrated patient-journey platforms. From our assessment, this creates an opportunity for suppliers able to combine technology with clinical or benefits-channel relationships, and for regional networks in under-penetrated markets such as India that can reach scale before larger operators enter. Participants positioned in only one tier, without a regional density advantage or proprietary technology, face the greatest competitive pressure.
The full report benchmarks competitive positioning across clinic networks, pharmaceutical suppliers, and laboratory-technology providers, assessing geographic reach, success-rate reputation, portfolio breadth, capability gaps, and consolidation activity within each tier and region. Where sufficiently granular information is available, the same intelligence can also be structured into a dataset tracking company, tier, business model, country, clinic count or capacity, product portfolio, technology category, market share, and acquisition activity by year. This enables users to filter and benchmark competitors by segment and region, monitor concentration trends, and identify consolidation targets and whitespace alongside the strategic findings of the report.
Leading Companies
Company Headquarters Market Position Core Strength Major Segments
- Vitrolife AB Sweden Global ART technology leader Culture media, lab devices, time-lapse imaging ART consumables and equipment
- CooperSurgical, Inc. USA Diversified fertility and women's health Broad ART device and reagent portfolio ART consumables
- Thermo Fisher Scientific Inc. USA Diversified life sciences leader Reagents, lab equipment ART supplies
- Merck KGaA Germany Pharmaceutical leader Hormonal fertility therapies Fertility drugs
- Ferring Pharmaceuticals Switzerland Specialty pharma leader Reproductive medicine drug portfolio Fertility drugs
- Cook Medical, Inc. USA Medical device specialist ART catheters and devices ART equipment
- Kitazato Corporation Japan Cryopreservation specialist Vitrification technology ART consumables
- Esco Micro Pte. Ltd. Singapore Lab equipment specialist Incubators, workstations ART equipment
- The Baker Company, Inc. USA Lab equipment specialist Cleanroom and biosafety equipment ART equipment
- Progyny Inc. USA Fertility benefits management leader Employer benefits platform Benefits administration
- Monash IVF Group Australia Regional clinic network leader Multi-site ART clinics Clinical services
- Virtus Health Australia Regional clinic network leader Multi-site ART clinics Clinical services
- Genea Limited Australia Clinic network and technology provider ART clinics plus proprietary tech Clinical services, technology
- Care Fertility Group UK Regional clinic network leader Multi-site ART clinics Clinical services
- The Fertility Partnership UK Regional clinic network leader Multi-site ART clinics Clinical services
- Medicover Group Sweden Diversified healthcare group Multi-country fertility clinics Clinical services
- Bourn Hall Fertility Center UK/global Pioneer clinic network Established ART clinic brand Clinical services
- Boston IVF USA Regional clinic network leader Multi-site ART clinics Clinical services
- Indira IVF India Large-scale emerging-market network High-volume ART clinics Clinical services
- Nova IVF Fertility India Emerging-market clinic network Multi-city ART clinics Clinical services
- Apollo Hospitals Enterprise Ltd. India Diversified hospital group Hospital-based fertility programs Clinical services
- Ovation Fertility USA Laboratory services specialist Embryology lab services Laboratory support
Why Do Competitive Structures Differ So Sharply Across Europe, Australia, India, and the U.S.?
Fertility competition follows four distinct regional models. Europe, which held the largest regional share at 33.3% in 2026, is served by clinic networks such as Care Fertility Group, The Fertility Partnership, and Bourn Hall, supported by an established treatment-seeking culture and a relatively supportive reimbursement environment. Australia has highly consolidated national networks, led by Monash IVF, Virtus Health, and Genea. In India, Indira IVF, Nova IVF Fertility, and Apollo Hospitals are scaling rapidly to serve a large, under-penetrated patient population. In the U.S., competition remains fragmented across regional networks and hospital-affiliated programs, while Progyny's benefits-platform model drives patient volume through employer relationships rather than direct clinic ownership.
Our analysis indicates that these structures reflect how each market's access conditions shape the route to scale. Where reimbursement and treatment-seeking culture are established, as in Europe, networks can grow on a stable base of demand. Where consolidation is already advanced, as in Australia, further growth depends on acquisition or expansion beyond the home market. In India, scale is being built ahead of demand maturity, since treatment penetration is low relative to the size of the eligible population and Asia Pacific is the fastest-growing region overall. In the U.S., our assessment is that the absence of consistent coverage has shifted influence toward employers and benefits platforms, which control access to patients without owning clinics.
In our view, the most significant implication is that regional leadership will depend on different factors in each market. In Europe, reputation and reimbursement alignment will be critical, while Australia may see further consolidation and cross-border expansion. In India, the speed of network build-out will shape competitive positioning, whereas employer-channel relationships will remain important in the U.S.
From our assessment, this creates an opportunity for international operators to enter India through partnership or acquisition before domestic leaders become entrenched, and for clinic networks in the U.S. to secure volume by integrating with employer-benefits platforms rather than competing on clinic count alone. Operators confined to a mature, consolidated home market to face the clearest need to look for growth elsewhere.
The full report benchmarks competitive intensity, network scale, consolidation level, and entry conditions across major regions and countries, and assesses how reimbursement, regulation, and patient-access dynamics shape competitive positioning in each. Where sufficiently granular information is available, the same intelligence can also be structured into a dataset tracking company, country, clinic network size, ownership, service model, reimbursement environment, market share, and expansion activity by year. This enables users to filter and compare regional competitive structures, track consolidation trends, and identify under-served markets and expansion targets alongside the strategic findings of the report.
Fertility M&A Being Driven by Geographic Scale, Technology Access, or the Pursuit of Integrated Patient-Journey Platforms?
Consolidation follows two parallel tracks. Clinic-network operators have been the most active acquirers, seeking geographic scale in the UK, Australia, and increasingly India. At the same time, ART technology and consumables suppliers continue to acquire to strengthen their laboratory-product portfolios. Across both tracks, the stated rationale falls into three themes: expanding treatment capacity in under-penetrated geographies, adding complementary laboratory technology, and building integrated patient-journey platforms that span diagnostics, treatment, and benefits administration. Transaction values and deal counts are not available in the source material, so this assessment rests on deal rationale and market structure rather than on transaction size.
Our analysis indicates that the geographic pattern of clinic deals reflects where the scale is still available. The UK and Australia are already relatively advanced in market consolidation, with acquisitions largely aimed at strengthening existing positions. In contrast, rising activity in India, one of the fastest-growing and least-penetrated markets, suggests that acquirers are seeking access to future patient volumes as well as existing treatment capacity. Our assessment is that the technology-side deals serve a different purpose. They are less about volume and more about widening the share of the ART workflow a supplier can serve, from culture media to cryopreservation and laboratory equipment. The third theme, integrated patient-journey platforms, is the one we believe is most strategically significant, because it moves acquirers beyond a single tier of the market.
In our view, the most significant implication is that M&A is becoming a route to bridging the gaps between tiers, not only to adding capacity within a tier. Clinic operators gain from adding technology and benefits-administration capabilities, while suppliers and platform providers gain proximity to the patient and the clinical outcome. From our assessment, this creates an opportunity for acquirers that can link diagnostics, treatment, and coverage into one offering, and regional networks in under-penetrated markets, which are likely to remain at attractive targets. We expect clinic-level consolidation to continue wherever fragmentation remains, but the strategic payoff will depend on how well acquirers integrate clinical performance, technology, and access rather than on the number of sites added.
The full report evaluates M&A activity by transaction rationale, acquirer and target type, geography, portfolio fit, and the effect on competitive structure, distinguishing capacity-driven deals from capability-driven and platform-building deals. Where sufficiently granular information is available, the same intelligence can also be structured into a dataset tracking transaction date, acquirer, target, deal type, geography, segment, strategic rationale, and disclosed value, with filters by tier and region. This lets users benchmark deal activity over time, identify the most active acquirers and likely next targets, and see where consolidation is concentrated alongside the strategic findings of the report.
Where Will Fertility Market Growth Concentrate Through 2036, and Which Business Models are Best Positioned to Capture It?
The market is projected to reach approximately USD XX billion by 2036, sustaining a CAGR over the 2026-2035 forecast period. Within this trajectory, growth is not evenly spread. Asia Pacific is expected to be the fastest-growing region and to keep narrowing the gap with Europe, which held the largest share at 33.3% in 2024. ART is expected to remain the dominant revenue segment, having accounted for roughly 71% of the market in 2024. Hospital-based fertility programs and employer-sponsored benefits platforms are expected to grow faster than the market average.
Our analysis indicates that the market's center of gravity is shifting from where treatment is delivered today toward how treatment is accessed and paid for. The segments growing fastest are the ones that widen access, whether through new regional clinic infrastructure, hospital programs that bring fertility into integrated health systems, or employer benefits that remove cost as a barrier. Our assessment is that this reflects a structural move toward integrated, insurance- and employer-connected treatment pathways, rather than a simple expansion of clinic capacity. ART's dominance is unlikely to be displaced, but the incremental value will increasingly come from the channels and regions around it.
In our view, the most significant implication is that future patient volume will favor companies that combine three things: strong clinical success-rate reputations, expanding geographic reach, and integrated technology platforms. A clinic operator strong in only one of these, for example a high-reputation network confined to a mature region, is likely to capture a shrinking share of growth. From our assessment, this creates an opportunity for operators that pair regional expansion in Asia Pacific with credible outcomes, and benefits platforms and hospital systems that connect coverage, diagnostics, and treatment into a single pathway. We expect this divergence between where revenue sits today and where incremental growth sits to widen over the forecast period.
The full report provides year-by-year market forecasts through 2036, regional and segment CAGR comparisons, and an assessment of how clinic-network expansion, hospital-based programs, employer benefits, and technology adoption influence the pace and distribution of growth. Where sufficiently granular information is available, the same intelligence can also be structured into a dataset tracking region, country, segment, end user, channel, and year. This lets users compare growth pockets side by side, monitor how the market mix changes over time, and identify the combinations of region, segment, and channel with the strongest outlook alongside the strategic findings of the report.
Key Strategic Questions Addressed
- How large is the global fertility market in 2025, and how fast is it expected to grow through 2035?
- Which product and service categories, end users, and regions are driving the largest value and the fastest growth?
- How large is the addressable patient population, and how wide is the gap between diagnosed need and actual treatment?
- How should pricing be assessed when the true cost of a live birth runs several multiples of the headline cycle price?
- How much of the regional growth gap is explained by reimbursement and regulation rather than underlying demand?
- Which companies, business models, and competitive tiers are best positioned across technology supply, clinic networks, and benefits platforms?
- Where are the largest white spaces, and how will employer benefits, emerging-market expansion, and fertility preservation shape growth through 2035?
Fertility Market Segments
By Product and Service
- Assisted Reproductive Technology (ART)
- Fertility Drugs (hormonal therapies)
- Fertility Diagnostics
- ART Consumables and Equipment
- Administration and Laboratory Support Services
By End User
- Fertility Clinics
- Hospitals
- Other end users (e.g., laboratory service providers and employer-sponsored benefits channels)
By Payment Model
- Self-pay
- Insurance
- Employer-sponsored
By Region
-
- North America (U.S.)
- Europe (UK, Sweden and other countries)
- Asia Pacific (China, India, Australia)
- Latin America
- Middle East & Africa
For inquiries regarding discounts, bulk purchases, or customization requests, please contact us at sales@precedenceresearch.com
Frequently Asked Questions
Tags





Ask For Sample
No cookie-cutter, only authentic analysis – take the 1st step to become a Precedence Research client
 Get a Sample
.webp)



 sales@precedenceresearch.com
 Schedule a Meeting