


Radiopharmaceuticals Market Size, Key Companies, Company Market Share, Patient Volume, Treatment Adoption Rates, Pricing Analysis, Regulatory Landscape, Competitive Positioning, and Demand Forecast
Radiopharmaceuticals Market (By Radioisotope: Iodine I, Gallium 68, Technetium 99m, Fluorine 18, Others; By Application: Cancer, Cardiology, Others; By Type: Diagnostic, Therapeutic; By End User: Hospitals and clinics, Medical Imaging centers, Others) - Global Industry Analysis, Size, Trends, Leading Companies, Regional Outlook, and Forecast 2026 to 2035
Source: https://www.precedenceresearch.com/radiopharmaceuticals-market
 Get a Sample
 Table Of Content


What is the Radiopharmaceuticals Market Size?
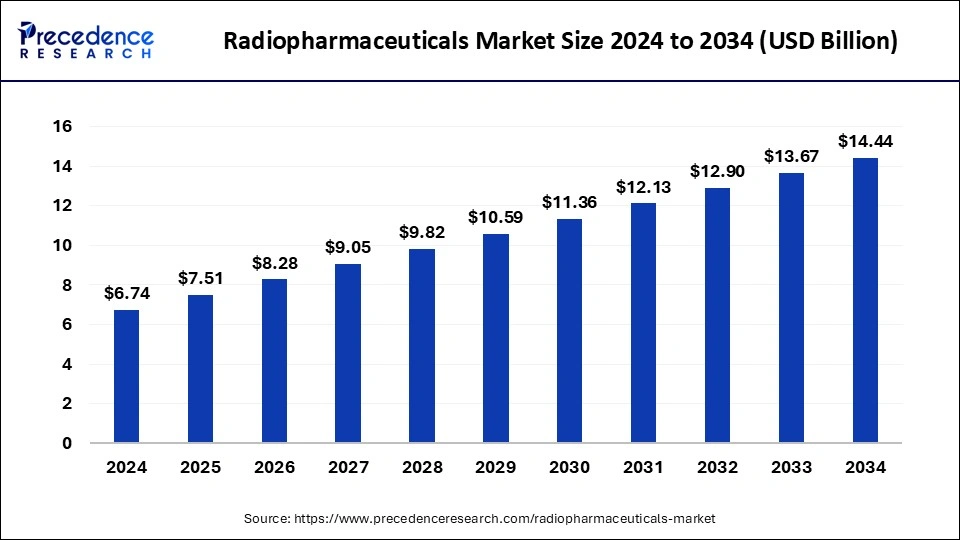
The global radiopharmaceuticals market size is accounted at USD 7.51 billion in 2025 and predicted to increase from USD 8.28 billion in 2026 to approximately USD 15.21 billion by 2035, representing a CAGR of 7.31% from 2026 to 2035.
Radiopharmaceuticals Market Key Takeaways
- North America led the market with the highest market share of 43.95% in 2025.
- Asia-Pacific is expected to expand at the fastest CAGR during the forecast period.
- By type, the therapeutic radiopharmaceuticals segment is expected to grow at the fastest rate in the market during the forecast period.
- By End User, the hospitals and clinics segment led the market in terms of revenue in 2025.
- By Source, the Technetium-99m segment captured a significant portion of the market in 2025.
- By source the Gallium-68 segment is projected to experience the highest growth rate in the market between 2026 and 2035.
Overview: Therapeutic Radioligands Are Turning a Diagnostic-Led Niche into a Multi-Billion-Dollar Oncology Category
The global radiopharmaceuticals market is estimated at approximately USD 9.0 billion in 2025, up from roughly USD 5 billion in 2020 (about 13% CAGR). It is projected to reach USD 21-22 billion by 2030, a CAGR of approximately 19% and an incremental opportunity of more than USD 12 billion. Diagnostics account for about 60% of 2025 revenue (roughly USD 5.4 billion), but therapeutics (roughly USD 3.6 billion) are growing at about 25-28% annually and are expected to overtake diagnostics in value by the end of the decade.
North America represents approximately 45% of global revenue, Europe 25%, Asia Pacific 22% and the rest of the world 8%. Asia Pacific is the fastest-growing region, supported by expanding PET infrastructure and rising oncology burden. Prostate and neuroendocrine cancers anchor current demand, while alpha-emitting therapies, new PET tracers and earlier-line treatment expansion define the next growth wave. The market is moderately concentrated with the top five suppliers hold an estimated 60–65% of revenue.
Key Coverage
- Historical, base-year and forecast revenue, 2020-2030
- Diagnostic vs. therapeutic revenue pools
- Regional and country-level forecasts
- Incremental opportunity by segment
- Market concentration and maturity indicators
- Isotope supply and infrastructure constraints
Market Size and Forecast
Base Case of USD 21.5 Billion by 2030, with Supply as the Swing Factor
The base case assumes therapeutic revenue grows from USD 3.6 billion to approximately USD 12 billion, while diagnostics expand from USD 5.4 billion to roughly USD 9 billion at an 11% CAGR. The upside scenario (about USD 25 billion) assumes earlier-line label expansions and timely commercial-scale alpha-isotope availability. The downside scenario (about USD 17 billion) reflects isotope shortages, slower nuclear-pharmacy capacity build-out and reimbursement friction. The full report quantifies revenue and administered-dose volumes by isotope, indication, region and 15 leading countries.
Segmentation Analysis
PSMA-Directed Agents Define the Largest Growth Pool
By type, PET diagnostics are the fastest-growing diagnostic category (around 13% CAGR), driven by PSMA, somatostatin-receptor, amyloid and tau tracers, while SPECT remains the volume backbone. Technetium-99m supports roughly 80% of SPECT procedures across an estimated 40 million nuclear medicine procedures annually. By therapeutic isotope, lutetium-177 leads with about 85% of therapeutic revenue, followed by radium-223 and iodine-131. Actinium-225 and lead-212 are the fastest-growing emerging isotopes, each from a small base. By application, oncology accounts for approximately 60% of revenue, cardiology about 20%, and neurology, thyroid and other uses the balance. Neurology is the emerging segment (amyloid and tau imaging), while legacy iodine-131 and older cardiac tracers are mature or declining. The report provides revenue, volume, share and CAGR for each dimension.
U.S. Radiopharmaceuticals Market Size and Growth 2026 to 2035
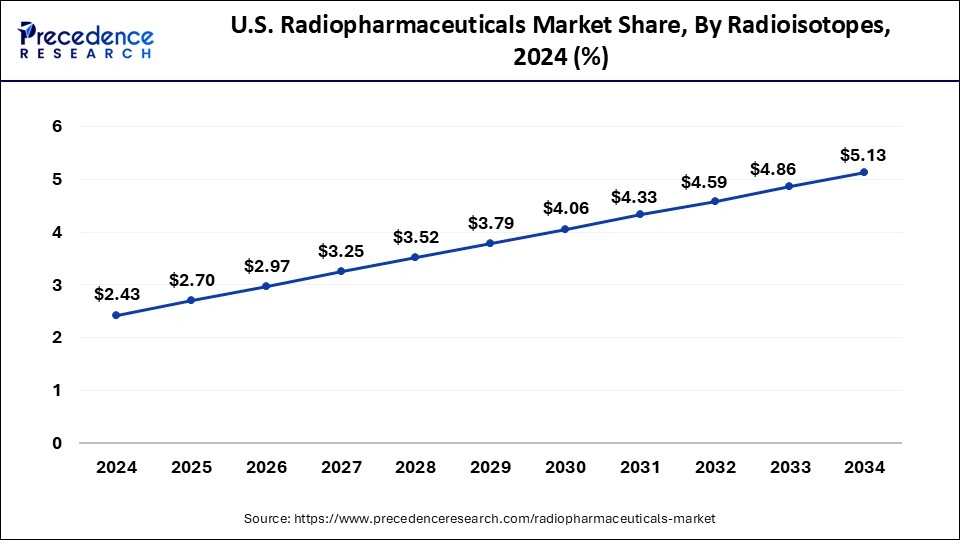
The U.S. radiopharmaceuticals market size was evaluated at USD 2.7 billion in 2025 and is projected to be worth around USD 5.4 billion by 2035, growing at a CAGR of 7.18% from 2026 to 2035.
Which Forces Will Most Strongly Accelerate or Restrain Radiopharmaceutical Growth, and Are the Constraints Structural or Solvable?
Demand-side evidence is strong. More than 1.5 million new prostate cancer cases are diagnosed annually, PSMA imaging has been adopted into clinical guidelines, label expansion into earlier treatment lines is under way, and more than 200 clinical-stage radiopharmaceutical programs are in development. Reimbursement reform is also improving access and diagnostic economics, including separate payment for higher-cost diagnostic agents in the US. Against this backdrop, the market faces four key restraints, including isotope supply constraints, a shortage of trained nuclear medicine professionals, short half-lives that necessitate just-in-time logistics, and the costs associated with radiation-safety compliance.
Our analysis indicates that the drivers and restraints act on different parts of the system. The growth drivers, which are clinical validation, guideline adoption and pipeline depth, are largely established and strengthening. The restraints sit in the physical and operational layer between a validated drug and a treated patient. Our assessment is that these restraints are not equally durable. Reimbursement friction and compliance costs are policy-dependent and are already being addressed through payment reform, so we view them as solvable. Isotope supply is solvable over time but requires capital and multi-year lead times, as the demand-supply analysis in this report shows. Workforce shortages and short half-lives are more structural. Trained staff cannot be added as quickly as drug approvals arrive, and decay-driven logistics will always limit geographic reach and scheduling flexibility.
In our view, the most significant implication is that growth is now limited more by delivery capacity than by clinical demand. Separate diagnostic reimbursement should strengthen the diagnostic base and the pairing of imaging with therapy, but it does not resolve the capacity questions that determine how many patients can be treated. We expect the market to reward participants that convert clinical validation into throughput, meaning those with secured isotope supply, regional manufacturing and dose-distribution networks, and qualified treatment sites. Companies that rely on clinical data alone are likely to see slower revenue conversion than the pipeline implies. From our assessment, this creates opportunities for providers of workforce training, dosimetry and site-enablement services, for regional manufacturers that shorten the distance to patients, and for developers of longer-lived or more logistically flexible isotope-ligand combinations.
The full report quantifies the impact of each driver and restraint on 2030 revenue, separating clinical, reimbursement, supply and operational effects. It classifies each force by direction, magnitude, timing and durability, and tests how faster or slower resolution of the key constraints moves the base, upside and downside scenarios.
The same intelligence can also be delivered as a structured market-drivers database. It would track drivers and restraints by category, region, isotope and indication, with fields for quantified revenue impact, expected timing, policy status and reimbursement decisions, and a durability rating. Users could filter by force type, geography or scenario to see which factors matter most for their planning horizon, complementing the report's strategic view with a structured, updateable evidence base.
Why do Radiopharmaceutical Prices Span Three Orders of Magnitude, and Which Pricing Tiers Are Most Likely to Sustain Margins Through 2030?
Pricing across the market varies by orders of magnitude. Legacy diagnostics such as FDG and Tc-99m kits are priced from tens to a few hundred USD per dose. Novel PET tracers command roughly USD 2,000-4,000 per dose, reflecting patent protection and reimbursement support. Lu-177 therapies are priced at approximately USD 40,000-48,000 per dose, equivalent to USD 190,000-260,000 per treatment course of four to six cycles in the US. Manufacturing, isotope, radiation-shielded logistics and dose-preparation costs together represent an estimated 25-35% of net therapeutic price, and therapeutic gross margins typically exceed 70%. Prices in Europe and Asia sit 30-50% below US levels.
Our analysis indicates that this spread reflects differences in IP protection, clinical differentiation and reimbursement design rather than differences in production cost alone. Legacy agents are largely commoditized, with generic competition and hospital purchasing consolidation continuing to exert pressure on prices, while much of the value generated accrues to the distribution layer. Novel tracers and therapies behave differently. Patent protection, dependence on a specific isotope-ligand combination and clinical guideline adoption give drug owners durable pricing power, and evidence to date suggests price stability in these categories. Our assessment is that the cost structure reinforces this view, with 25-35% of net price absorbed by supply-chain and preparation costs. The remaining margin is sufficient to support continued investment in isotope security and manufacturing capacity.
In our view, the most significant implication is that profitability will increasingly depend on isotope and manufacturing control rather than on list price. The 30-50% regional price gap also means that revenue growth in Europe and Asia Pacific will depend more on volume and treatment-center access than on price, so companies should expect uneven margin contribution by region. Diagnostic agents without clinical or reimbursement differentiation are likely to see continued erosion, while premium pricing is most defensible for agents with clear reimbursement pathways and secured isotope supply. From our assessment, this creates an opportunity for suppliers that can lower per-dose supply and logistics costs, since that is the one cost lever available in a market where price is set largely by clinical value and payer policy.
The full report provides price benchmarks by isotope, product class and region through 2030, including manufacturing, isotope, logistics and dose-preparation cost build-ups, distributor and nuclear pharmacy margins, price pass-through and elasticity, and scenario-based pricing outlooks. It also tests how payer reform and generic entry could shift the pricing tiers described above.
The same intelligence can also be delivered as a structured pricing database. It would track price per dose and per treatment course by product, isotope, indication, region and year, alongside reimbursement status, cost-structure fields and gross margin estimates, with filtering and benchmarking by product class, geography and pricing tier. The dataset complements the report by allowing clients to benchmark their own price points and model pricing scenarios against the strategic view above.
Which Isotopes Will Constrain Radiopharmaceutical Growth Through 2030, and Can Domestic Production Investment Close the Gap?
Isotope supply is concentrated at every stage of the market. Molybdenum-99, the parent of Tc-99m, is produced by only about six research reactors globally, which together supply weekly demand of roughly 9,000-10,000 six-day curies. Reactor ageing and unplanned outages cause recurring shortages. Lutetium-177 supply has scaled through both reactor and enriched-target routes but remains tight relative to projected 2030 therapy volumes. Actinium-225 supply is a small fraction of clinical-scale demand, with accelerator and generator production only now reaching commercial scale. Trade dependency compounds a small number of exporting countries supply most medical isotopes, while Europe, North America and Asia Pacific each import specific isotopes. Announced isotope-production projects represent well over USD 1 billion of capital investment.
Our analysis indicates that the constraint differs by isotope, and so does its consequence. Mo-99 presents a supply reliability challenge. Supply is generally adequate under normal conditions, but the limited number of reactors means that a single outage can disrupt diagnostic procedures across multiple regions. Lu-177 is a scaling problem. Supply has expanded, but the therapeutic revenue pool is projected to grow roughly threefold by 2030, and we believe demand from earlier-line indications could outpace capacity if approvals arrive faster than expansion. Ac-225 is an availability problem, since supply is small relative to what commercial alpha-therapy programs will require. Our assessment is that alpha-emitter supply is the most consequential of the three because it determines how quickly the next therapeutic wave can reach patients at scale.
In our view, the most significant implication is that secured isotope supply is becoming a source of competitive advantage, not just an operating input. Companies with long-term supply agreements, non-reactor production routes or integrated isotope-to-drug models are better placed to convert clinical success into revenue, while those dependent on spot supply face volume risk. The trade concentration also explains why import substitution has become a policy priority. However, new production projects take years to reach commercial output, so we expect the imbalance to ease unevenly. Mo-99 and Lu-177 supply should improve first, while Ac-225 and other alpha isotopes are likely to remain tight for longer. From our assessment, this creates an opportunity for accelerator-based and alternative-route isotope producers, for regional suppliers serving import-dependent markets, and for drug developers that secure supplies ahead of their launch timelines.
The full report models supply-demand balances by isotope through 2030, covering production capacity, utilization, planned additions, lead times and regional surplus or deficit. It also quantifies trade flows, import dependency by region and the investment pipeline behind domestic production, and tests how outage, delay and approval-timing scenarios affect the base case.
The same intelligence can also be delivered as a structured isotope supply database. It would track production facilities and projects by isotope, country, production route, capacity, operational status, commissioning year and announced investment, with supply-agreement and trade-flow fields. Users could filter by isotope, region or production technology to benchmark supply security and identify capacity gaps, complementing the report's strategic view with facility-level detail for supply planning.
Where Does Value Concentrate Across the Radiopharmaceutical Value Chain, and Which Bottlenecks Will Shift Margin Between Stages?
The value chain runs from target materials and isotope production, through radiochemistry and GMP manufacturing, to nuclear pharmacy distribution and clinical administration. Isotope production earns margins of 15-25% at scale but is highly concentrated. Nuclear pharmacies earn distribution margins of 10-20%. Drug developers retain the largest margin pool, particularly for patented therapeutics, where gross margins typically exceed 70% and manufacturing, isotope, logistics and dose-preparation costs together absorb an estimated 25-35% of net price. The main bottlenecks are enriched target materials, alpha-isotope production and GMP-capable CDMO capacity.
Our analysis indicates that margin follows intellectual property and scarcity rather than physical effort. Drug owners capture the most value because patent protection and clinical differentiation set price. Nuclear pharmacies operate in a lower-margin, service-like tier, where returns depend on route density, dose-preparation reliability and short-half-life logistics. Isotope producers occupy an intermediate position in the value chain, generating 15-25% margins that are healthy for an industrial activity but constrained by supplier concentration, long capital lead times, and pricing dependence on drug owners' volumes.
Our assessment is that the three bottlenecks matter most because they sit at stages where supply is concentrated and cannot be scaled quickly, which gives whoever controls them growing leverage.
In our view, the most significant implication is that the margin pool is likely to migrate toward the scarce upstream and midstream capabilities that gate therapeutic volume. Drug owners will keep the largest absolute margin, but those without secured isotope supply or GMP capacity risk ceding value, or launch timing, to suppliers who control those inputs. This explains the pull toward vertical integration and long-term supply agreements. We expect drug owners to keep securing upstream access, and independent isotope and CDMO providers with scarce, qualified capacity to gain negotiating power. From our assessment, this creates opportunities for alpha-isotope and enriched-target producers, for CDMOs with therapeutic-grade GMP capacity, and for nuclear pharmacy operators that can extend from distribution into dose preparation and clinical support. Distribution-only models with no capability advantage are the most exposed to margin compression.
The full report quantifies cost contribution and margin pools at each stage, supplier concentration by input, distribution economics and logistics constraints, and maps where bottlenecks are likely to ease or tighten through 2030. It also assesses how integration strategies and scenario shifts in isotope supply and CDMO capacity could redistribute margin between stages.
The same intelligence can also be delivered as a structured value-chain database. It would track participants and facilities by stage, covering isotope production, target-material supply, radiochemistry and GMP manufacturing, CDMO capacity, and nuclear pharmacy networks. Key fields would include geography, production route, capacity, operational status, integration model and margin benchmarks, with filtering by stage, region or isotope. The dataset complements the report by giving clients facility-level detail for supplier screening, partnership targeting and capacity-gap analysis.
Which Technology, Regulatory and Customer Shifts Will Determine How Quickly Radiopharmaceutical Therapy Scales Beyond Today's Core Indications?
Radioligand technology is moving from small-molecule ligands toward peptides, antibodies and nanobodies, next-generation chelators, alpha emitters and combination regimens with immunotherapy. Patent activity in radioligand therapy has more than doubled over the past five years. On the regulatory side, drug-approval requirements are layered with radiation-safety, transport and waste-disposal rules, and recent policy trends include separate reimbursement for diagnostic radiopharmaceuticals, isotope-independence programs and dose-optimization mandates. Customers are hospital nuclear medicine departments, imaging centers and oncology networks. Their purchasing criteria emphasize supply reliability, regulatory approval and reimbursement, and price sensitivity is highest for legacy agents. Switching costs are meaningful for therapeutics because treatment protocols and site qualification create stickiness.
Our analysis indicates that these three forces are linked. Broader ligand and isotope platforms expand the range of tumor targets that can be addressed, and the doubling of patent activity suggests competition is shifting from single products to platform ownership across targeting molecules, chelators and isotope combinations. Our assessment is that regulation and customer structure, rather than science, now set the pace of commercialization. Separate reimbursement for diagnostic agents improves imaging economics and supports the pairing of diagnostics with therapy for patient selection. Isotope-independence programs address the supply constraint described elsewhere in this report, and dose-optimization mandates point toward more individualized, dosimetry-guided treatment. The customer base is also specialized. Therapeutic adoption depends on qualified treatment sites with radiation-safety infrastructure and trained staff, and once sites are qualified and protocols established, they tend not to switch.
In our view, the most significant implication is that treatment-center capacity and site qualification, not clinical evidence alone, will determine how fast new therapies reach patients. Companies that qualify sites early, support them with application engineering and dosimetry, and align products with reimbursement pathways should build durable adoption advantages, because switching costs reward the first entrant to a site. Conversely, new modalities such as alpha emitters and antibody-based agents may face slower uptake in regions where treatment infrastructure lags. We believe dose-optimization requirements will raise the bar for evidence and site capability, favoring suppliers that can offer more than the drug itself. From our assessment, this creates opportunities for developers of next-generation chelators and alternative targeting modalities, for providers of site-enablement, dosimetry and training services, and for suppliers targeting under-served regions where infrastructure build-out is still early.
The full report analyzes these dynamics in greater depth. It covers the technology landscape by ligand class, chelator and isotope, with patent and pipeline activity. It maps regulatory requirements and reimbursement policy by region and assesses their effect on adoption timing. It also examines customer segments, purchasing criteria, qualification requirements and switching barriers, and includes site-level infrastructure data and treatment-center capacity benchmarks by region.
The same intelligence can also be delivered as a structured treatment-site and infrastructure database. It would track nuclear medicine and therapy sites by country and region, with fields for site type, therapeutic and diagnostic capability, isotopes handled, treatment capacity, qualification status and regulatory or reimbursement environment. Users could filter and benchmark by geography, site type or capability to identify capacity gaps and prioritize launch and partnership targets, complementing the report's strategic view with site-level detail.
Is Big Pharma's Entry Into Radiopharmaceuticals Consolidating Control of the Market, or Are Specialists and Isotope Producers Retaining Leverage?
The market has three competitive tiers. Global pharmaceutical companies own the commercial therapeutic franchises and are buying their way into the space. Specialist and imaging-focused players dominate diagnostics, and isotope and manufacturing specialists control the supply base. Concentration is highest in therapeutics, where the leading supplier holds approximately 90% of current Lu-177 revenue, and lowest in nuclear pharmacy and legacy diagnostics. Overall, the top five suppliers hold an estimated 60-65% of market revenue and the top ten approximately 78-80%. Four recent transactions (BMS-RayzeBio, AstraZeneca-Fusion, Novartis-Mariana Oncology and Lilly-POINT Biopharma) total close to USD 10 billion in announced value.
Our analysis indicates that the market is not consolidating evenly. It is concentrated where products are patented and clinically proven, and fragmented where products are commoditized or service-based. The near-monopoly in Lu-177 therapy reflects first-mover advantage, clinical validation and treatment-site qualification. However, our assessment is that this position is more contestable than the 90% share suggests. The pharma entrants have paid for platforms, pipelines and isotope access rather than for current revenue, which indicates they are positioning for the next therapeutic wave, particularly alpha-emitters and non-prostate solid tumors. The three tiers are also converging. Pharma companies are moving upstream toward isotope and manufacturing control, isotope producers are moving downstream toward drug development, and diagnostic specialists are extending into theranostics.
In our view, the most significant implication is that competitive advantage will increasingly depend on three capabilities, including a differentiated targeting platform, secured isotope supply, and qualified treatment-site reach. Pharma entrants bring capital and commercial scale but are still building supply and site networks, while isotope and manufacturing specialists hold scarce capacity but lack drug-owner economics. We therefore expect partnerships, supply agreements and further acquisitions of late-stage theranostic assets and alpha-isotope capacity to continue. From our assessment, this creates opportunities for specialists with differentiated alpha or non-prostate pipelines, for isotope and CDMO providers with scarce qualified capacity, and for diagnostic players that can use their installed imaging base to feed therapy pipelines. Companies dependent on legacy diagnostics or distribution alone face the greatest margin and share risk.
The full report benchmarks each participant on revenue, market share, growth, profitability, capacity, product exposure, geographic presence and strategic activity. It classifies companies as scale leaders, technology leaders, growth leaders, regional leaders or emerging challengers, and identifies capability gaps in isotope security, portfolio breadth and treatment-center reach. It also assesses which combinations of partnership and acquisition are most likely to reshape share through 2030.
The same intelligence can also be delivered as a structured competitive database. It would track companies, products and pipeline assets by isotope, ligand class, indication, development stage and regulatory status, alongside revenue, estimated share, manufacturing sites, supply agreements and transaction records. Users could filter and benchmark by segment, region or capability to screen competitors, partners and acquisition targets, complementing the report's strategic view with asset-level detail.
Tentative Leading Company Universe
| Company | HQ | Market Position | Core Strength | Major Applications | |
| 1 | Novartis | Switzerland | Therapeutic leader | Lu-177 franchise, global scale | Prostate, NETs |
| 2 | Lantheus | US | Diagnostic leader | PSMA PET tracer, cardiology | Prostate imaging, cardiac |
| 3 | Curium | France | Global scale leader | Broad SPECT/PET portfolio | Oncology, cardiac |
| 4 | GE HealthCare | US | Diagnostic leader | Imaging and agents integration | Cardiac, neuro, oncology |
| 5 | Bayer | Germany | Alpha therapy pioneer | Radium-223 | Prostate bone metastases |
| 6 | Cardinal Health | US | Nuclear pharmacy leader | Distribution network | Multi-application |
| 7 | Telix | Australia | Theranostic challenger | Imaging portfolio, pipeline | Prostate, kidney, brain |
| 8 | Jubilant Radiopharma | India | Regional/global supplier | Kits, nuclear pharmacy | Cardiac, oncology |
| 9 | Eckert & Ziegler | Germany | Isotope and sources specialist | Lu-177, Ge-68 supply | Therapeutics, PET |
| 10 | Bracco | Italy | Imaging specialist | PET tracers, contrast | Oncology, cardiac |
| 11 | Siemens Healthineers (PETNET) | Germany/US | PET manufacturing network | Cyclotron footprint | FDG and PET agents |
| 12 | ITM | Germany | Isotope and therapy developer | Lu-177 supply, late-stage therapy | NETs |
| 13 | Eli Lilly | US | Pharma entrant | Radioligand pipeline | Oncology |
| 14 | Bristol Myers Squibb | US | Pharma entrant | Clinical pipeline, platform | Solid tumors |
| 15 | AstraZeneca | UK | Pharma entrant | Alpha and targeted pipeline | Oncology |
| 16 | Orano Med | France | Alpha isotope specialist | Pb-212 production | Alpha therapy |
| 17 | NorthStar | US | Isotope innovator | Non-reactor isotope production | Isotope supply |
| 18 | SHINE | US | Isotope innovator | Fusion-based isotopes | Lu-177, Mo-99 |
| 19 | Nordion | Canada | Isotope supplier | Established isotope sales | Sterilization, medical |
| 20 | Clarity | Australia | Copper-based challenger | Cu-64/Cu-67 theranostics | Prostate, neuroblastoma |
| 21 | Perspective Therapeutics | US | Alpha specialist | Pb-212 pipeline | NETs, melanoma |
| 22 | Nihon Medi-Physics | Japan | Regional leader | Domestic supply | Diagnostics, therapy |
Market Share and Ranking: Novartis and Lantheus Capture the Largest Revenue Pools
Novartis holds an estimated 28–30% of global revenue, Lantheus 15–17%, Curium 12–14%, Bayer 4–5% and GE HealthCare 6–8%. The top five combined represent approximately 60–65%, and the top ten approximately 78–80%. Share gains are concentrated in PSMA therapeutics and PET diagnostics, while legacy SPECT share is stable. The report provides estimated share by revenue segment, year and region.
Competitive Benchmarking: Isotope Access, Regulatory Pipeline and Manufacturing Reach Determine Advantage
Benchmarked KPIs include revenue, growth, margin, isotope security, manufacturing footprint, approved products, pipeline depth, customer reach and strategic investment, rated as Leader / Strong / Moderate / Emerging.
- Product portfolios: Broad-portfolio leaders are Curium, GE HealthCare and Cardinal Health. Specialty leaders are Novartis, Lantheus and Bayer, and challengers are Telix, Clarity and ITM. Gaps exist in alpha therapeutics, neurology and non-prostate solid tumors.
- Technology: Patent activity and pipeline breadth are strongest among large pharma entrants and the alpha specialists. Lu-177 remains the clinically proven platform, while Ac-225 and Pb-212 programs drive differentiation.
- Application: Application leaders are Novartis in prostate and NET therapy, Lantheus in prostate imaging and Curium in cardiac and oncology SPECT. White spaces include breast, lung and neurological therapeutic indications.
- Geography: Global leaders are Novartis, Curium and GE HealthCare. Regional leaders include Nihon Medi-Physics in Japan and Jubilant in India and North America, while local specialists serve emerging markets.
- Manufacturing and capacity: The report benchmarks cyclotron footprints, GMP therapeutic manufacturing sites, isotope supply agreements, capacity additions and vertical integration.
- Customer and channel: Cardinal Health and PETNET lead in distribution reach, while Novartis leads in treatment-center qualification and clinical support.
Strategic Developments and M&A: Big Pharma Has Committed Over USD 10 Billion to Radioligand Platforms
Recent transactions include BMS–RayzeBio (about USD 4.1 billion), AstraZeneca–Fusion (up to about USD 2.4 billion), Novartis–Mariana Oncology (up to about USD 1.75 billion) and Lilly–POINT Biopharma (about USD 1.4 billion). Lantheus has added to its pipeline through Evergreen Theragnostics and Life Molecular Imaging. Earlier, Novartis acquired Endocyte (about USD 2.1 billion) and Advanced Accelerator Applications (about USD 3.9 billion). Recent strategic actions also include new isotope plants, long-term isotope supply agreements, PET-manufacturing expansion and CDMO investment. Future M&A themes include alpha-isotope security, GMP manufacturing capacity and late-stage theranostic assets.
Company Profiles
The full report profiles all 22 companies across overview, market position, financials (total and radiopharma-relevant revenue, growth, margin, R&D, capex), product portfolio, application exposure, geographic footprint, manufacturing, innovation, strategic developments and competitive strengths and risks.
Strategic Positioning: Who is Best Placed for Future Growth?
Market Leaders are Novartis, Lantheus and Curium. Growth Leaders include Telix and Lantheus. Technology Leaders are Bayer, Orano Med, Perspective Therapeutics and Clarity. Scale Leaders are Novartis, GE HealthCare and Cardinal Health. Regional Leaders include Nihon Medi-Physics and Jubilant. Application Specialists include ITM and Bracco. Emerging Challengers include Lilly, BMS and AstraZeneca, with SHINE and NorthStar supplying isotopes.
Opportunity, Industry Structure and Attractiveness
White space: Alpha-emitter supply and therapies (a multi-billion-dollar opportunity by 2030), non-prostate solid tumors, neurology, emerging-market PET access (where penetration lags developed markets by 5–10 procedures per 1,000 people) and domestic isotope production.
Industry structure (Porter's Five Forces):
- Supplier power is High, given concentrated reactor and enriched-target supply.
- Buyer power is Medium, with hospital purchasing groups strong in legacy diagnostics and weaker in patented therapeutics.
- Threat of new entrants is Medium, as regulatory, isotope-access and radiation-safety barriers are high but big-pharma capital is entering.
- Threat of substitutes is Medium, mainly from immunotherapy and targeted small molecules.
- Competitive rivalry is Medium to High and rising.
PESTLE highlights: Political forces include isotope-security policy and localization incentives. Economic forces include reimbursement reform. Social forces include an ageing population and rising cancer incidence. Technological forces include alpha emitters and next-generation chelators. Legal forces include radiation-safety and transport regulation. Environmental forces include radioactive waste management.
Market attractiveness: PSMA and NET therapeutics are Highly Attractive. Novel PET diagnostics are Attractive. Alpha therapeutics and neurology are Attractive with higher risk. Legacy SPECT is Moderate, and commodity FDG production is Challenging.
Which Scenario Is Most Likely to Define Radiopharmaceutical Market Value in 2030, and Where Will Profit Pools Concentrate?
Therapeutics are projected to represent approximately 57% of market value by 2030. Base case revenue is USD 21.5 billion, with an upside case of USD 25 billion and a downside case of USD 17 billion. From an estimated USD 9.0 billion in 2025, these scenarios imply CAGRs of roughly 23%, 19% and 14%, respectively. Pricing is expected to remain stable in therapeutics and decline modestly for legacy diagnostics.
Our analysis indicates that the USD 8 billion gap between the upside and downside cases is driven less by demand than by execution. Clinical demand is broadly evident, with the therapeutic patient pool projected to expand approximately threefold in the base case, while earlier-line use represents the primary upside opportunity. The variables that separate the scenarios are the timing of label expansions, the pace of alpha-isotope availability and the build-out of GMP manufacturing and treatment-center capacity. Our assessment is that the base case is the most probable outcome, but that it carries more downside risk than upside risk. Isotope shortages, capacity delays and reimbursement friction all compress value simultaneously, whereas the upside requires several enabling conditions to arrive together.
In our view, the most significant implication is that profit pools will concentrate with participants who control scarce inputs, not just those who own approved products. With therapeutic prices stable and legacy diagnostic prices eroding, margin expansion will favor drug owners with secured isotope supply. Those without it risk volume constraints that offset price stability.
We expect the winners to be leaders with proven platforms, alpha specialists and isotope producers with commercial-scale output. Legacy diagnostics and distribution-only models are likely to lose relative share of profit. Our assessment identifies three strategic priorities, including securing isotope supply ahead of launch timelines, scaling GMP manufacturing capacity, and expanding networks of qualified treatment centers. This creates opportunities for suppliers and service providers that help close these three gaps, and for investors positioned in alpha-emitter supply and therapeutic manufacturing capacity.
The full report provides forecasts through 2030 by segment, isotope, application, and region. It covers diagnostic and therapeutic revenue, volume, pricing and margin outlooks, and quantifies the assumptions and triggers behind each scenario. It also assesses capacity, competitive and M&A outlooks, and identifies the technologies, applications and geographies most likely to shape future profit pools.
The same intelligence can also be delivered as a structured forecast database. It would track revenue, volume and price by isotope, product class, indication, region and year, with base, upside and downside values and the key assumptions behind each. Users could filter by segment or scenario, compare forecast paths and adjust assumptions to test their own planning cases, complementing the report's strategic view with model-ready detail.
Recent Developments
- In February 2025, Eli Lilly announced a strategic collaboration with Australian start up AdvanCell to develop targeted radiopharmaceutical therapies for hard to treat cancers. This partnership leverages AdvanCell's expertise in lead-212 isotope production and Lilly's oncology pipeline to create novel treatments aimed at improving patient outcomes in precision oncology. (Source: 2025 starts strong for Eli Lilly with major M&A and partnerships)
- In January 2025, Novartis completed the acquisition of Mariana Oncology, a U.S. based radiopharmaceutical company, for $1 billion. This acquisition strengthens Novartis' position in the rapidly growing field of radiopharmaceuticals, particularly in precision cancer treatments, and expands is capabilities in developing and manufacturing targeted therapies using radioactive isotopes. (Source: 2025 M&A Deal Trends in Life Sciences | Clarkston Consulting)
Segments Covered in the Report
By Radioisotope
- Iodine I
- Gallium 68
- Technetium 99m
- Fluorine 18
- Others
By Application
- Cancer
- Cardiology
- Others
By Type
- Diagnostic
- Therapeutic
By End User
- Hospitals and clinics
- Medical Imaging centers
- Others
By Geography
- North America
- Europe
- Asia-Pacific
- Latin America
- Middle East and Africa
For inquiries regarding discounts, bulk purchases, or customization requests, please contact us at sales@precedenceresearch.com
Frequently Asked Questions





Ask For Sample
No cookie-cutter, only authentic analysis – take the 1st step to become a Precedence Research client
 Get a Sample
.webp)



 sales@precedenceresearch.com
 Schedule a Meeting