Europe Composites Market Size is USD 24.46 Billion in 2026
Europe Composites Market (By Manufacturing Process: Layup, Filament, Injection Molding, Pultrusion, Compression Molding, Resin Transfer Molding (RTM), Others; By Product: Carbon Fiber, Glass Fiber, Others; By Application: Automotive & Transportation, Electrical & Electronics, Wind Energy, Construction & Infrastructure, Pipes & Tanks, Marine, Others) Industry Size, Share, Growth, Trends 2026 to 2035.


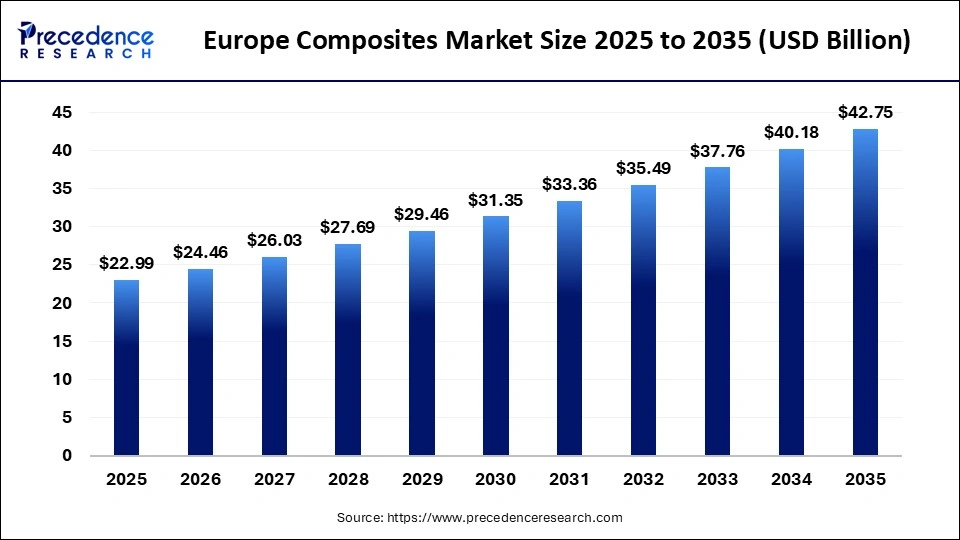
The Europe composites market size was estimated at USD 22.99 billion in 2025 and is expanding at a CAGR of 6.40% from 2026 to 2035. Due to rising demand from automotive, aerospace and construction sectors, lightweight, durable materials improve fuel efficiency and performance while sustainability trends and innovations in recycling and bio-based composites support market growth.
Europe Composites Market Statical Scope
| Reports Attributes | Statistics |
| Market Size in 2025 | USD 22.99 Billion |
| Market Size in 2026 | USD 24.46 Billion |
| Market Size by 2035 | USD 42.75 Billion |
| CAGR 2026 to 2035 | 6.40% |
| Base Year | 2025 |
| Forecast Period | 2026 to 2035 |
Technological advancements in the European composites market are driven by automation digital manufacturing and advanced material innovation techniques like automated fiber placement and resin transfer moulding improve precision and reduce production time. Additionally, the adoption of thermoplastic composites, Ai-based quality control and recyclable or bio-based materials enhance efficiency, sustainability and performance.
Europe Composites Market Share, By Country, 2025 (%)
- Germany - Germany is among the leading producers in the global composites market because growth is largely driven by increasing demand from the automotive and aerospace sectors in particular initiatives such as future Combat Air System projects are expected to boost the use of advanced composite materials, supporting innovation in lightweight design and enhancing performance across aerospace applications.
- U.K. - Due to their use in offshore electrical and electronics insulation, additionally, the steady expansion of the country. Expansion of the country's Marine Industries is anticipated to further boost demand by supporting the adoption of lightweight, durable and core corrosion resistant materials across various industrial and Maritime Applications in the coming year.
Europe Composites Market Share, By Manufacturing Process, 2025 (%)
| Segments | Shares (%) |
| Layup | 35% |
| Filament | 10% |
| Injection Molding | 12% |
| Pultrusion | 8% |
| Compression Molding | 13% |
| Resin Transfer Molding (RTM) | 12% |
| Others | 10% |
- Layup - The segment dominated the market with a 35% share, due to its cost-effectiveness, design flexibility and suitability for low volume production, making it widely used in aerospace, marine and customized structural applications.
- Filament - The segment accounted for 10% of the total market share, due to its efficiency in producing cylindrical structures like pipes and tanks, especially for industrial and energy applications.
- Injection Molding - The segment accounted for 12% of the total market share, due to its high production speed, cost efficiency and suitability for complex shapes in automotive and consumer applications.
- Pultrusion - The segment accounted for 8% of the total market share, due to its efficiency in producing continuous high-strength profiles widely used in construction infrastructure and electrical applications.
- Compression Molding - The segment accounted for 13% of the total market share, due to its ability to produce strong lightweight parts at scale, especially for automotive and industrial uses.
- Resin Transfer Molding (RTM) - The segment accounted for 12% of the total market share, due to its ability to produce high-quality lightweight components with an excellent surface finish used in the aerospace and automotive sectors.
- Others - The segment accounted for 10% of the total market share, due to its inclusion of niche and specializing in processes used for customized applications with limited but steady industrial demand.
Europe Composites Market Share, By Product, 2025 (%)
| Segments | Shares (%) |
| Glass Fiber | 56% |
| Carbon Fiber | 25% |
| Others | 19% |
- Glass Fiber - The segment dominated the market with a 56% share, due to its low cost, good strength, corrosion resistance and wide usage across construction, automotive and wind energy applications.
- Carbon Fiber - The segment accounted for 25% of the total market share, due to its high strength of weight ratio stiffness and growing use in aerospace, automotive and high-performance applications.
- Others - The segment accounted for 19% of the total market share, due to niche fibers like aramid and natural fibers used in specialized applications requiring impact resistance flexibility or sustainability benefits.
Europe Composites Market Share, By Application, 2025 (%)
| Segments | Shares (%) |
| Automotive & Transportation | 23% |
| Electrical & Electronics | 14% |
| Wind Energy | 16% |
| Construction & Infrastructure | 15% |
| Pipes & Tanks | 10% |
| Marine | 8% |
| Others | 14% |
- Automotive & Transportation - The segment dominated the market with a 23% share, due to growing demand for lightweight materials that improve fuel efficiency, reduce emissions and enhance overall vehicle performance.
- Electrical & Electronics - The segment accounted for 14% of the total market share, due to strong demand for insulating heat resistance and lightweight materials used in components circuit systems and advanced electronics devices.
- Wind Energy - The segment accounted for 16% of the total market share, due to the need for strong lightweight and durable materials for turbine blades supporting efficiency and longer operational life.
- Construction & Infrastructure - The segment accounted for 15% of the total market share, due to demand for durable corrosion resistance and lightweight materials used in bridge buildings and civil engineering projects.
- Pipes & Tanks - The segment accounted for 10% of the total market share, due to the need for corrosion-resistance, lightweight and durable materials in water chemical and industrial storage applications.
- Marine - The segment accounted for 8% of the total market share, due to demand for lightweight corrosion resistance and high-strength material used in boats, ships and offshore structures.
- Others - The segment accounted for 14% of the total market share, due to specializing in emerging applications that require Shadows composites materials for niche industries with unique performance or durability needs.
Top Companies in the Europe Composites Market
- Toray Industries, Inc.
- Owens Corning
- Nippon Electric Glass Co., Ltd.
- Huntsman International LLC
- SGL
- Hexcel Corporation
- DowDuPont Inc
- Compagnie de Saint-Gobain S.A.
- Weyerhaeuser Company
- Momentive Performance Materials, Inc.
- Solvay
- China Jushi Co., Ltd.
Segments Covered in the Report
By Manufacturing Process
- Layup
- Filament
- Injection Molding
- Pultrusion
- Compression Molding
- Resin Transfer Molding (RTM)
- Others
By Product
- Carbon Fiber
- Glass Fiber
- Others
By Application
- Automotive & Transportation
- Electrical & Electronics
- Wind Energy
- Construction & Infrastructure
- Pipes & Tanks
- Marine
- Others
| Manufacturing Process | 2025 | 2026 | 2027 | 2028 | 2029 | 2030 | 2031 | 2032 | 2033 | 2034 | 2035 |
|---|---|---|---|---|---|---|---|---|---|---|---|
| Layup | 0.59 | 1.71 | 3.98 | 1.33 | 0.08 | 0.59 | 0.70 | 1.53 | 0.90 | 0.97 | 3.56 |
| Filament | 3.78 | 1.30 | 1.95 | 2.51 | 4.71 | 1.98 | 1.33 | 3.25 | 1.49 | 6.10 | 0.05 |
| Injection Molding | 1.65 | 0.79 | 0.43 | 2.01 | 1.61 | 1.53 | 4.45 | 4.46 | 0.56 | 0.40 | 2.26 |
| Pultrusion | 1.15 | 2.17 | 0.12 | 0.81 | 0.24 | 3.30 | 0.54 | 0.75 | 4.39 | 1.60 | 0.81 |
| Compression Molding | 0.21 | 0.34 | 1.36 | 2.28 | 0.01 | 0.97 | 0.99 | 0.23 | 4.04 | 2.06 | 3.26 |
| Resin Transfer Molding (RTM) | 0.21 | 0.79 | 0.68 | 0.08 | 1.84 | 0.19 | 2.63 | 0.51 | 0.36 | 0.39 | 0.60 |
| Others | 0.08 | 1.05 | 0.15 | 0.20 | 1.33 | 1.89 | 0.49 | 1.10 | 0.85 | 1.87 | 3.70 |
| Others | 2.27 | 0.77 | 6.68 | 4.87 | 0.26 | 4.13 | 3.27 | 0.02 | 0.65 | 5.46 | 0.62 |
| Others | 0.44 | 4.16 | 4.34 | 2.77 | 0.84 | 3.34 | 2.17 | 0.87 | 0.41 | 2.85 | 2.92 |
| Product | 2025 | 2026 | 2027 | 2028 | 2029 | 2030 | 2031 | 2032 | 2033 | 2034 | 2035 |
|---|---|---|---|---|---|---|---|---|---|---|---|
| Carbon Fiber | 3.70 | 2.10 | 1.90 | 0.46 | 4.49 | 4.01 | 1.49 | 5.47 | 6.17 | 2.49 | 2.05 |
| Glass Fiber | 1.69 | 5.29 | 0.10 | 3.90 | 5.07 | 2.31 | 6.36 | 6.33 | 5.77 | 5.44 | 11.58 |
| Others | 0.08 | 1.05 | 0.15 | 0.20 | 1.33 | 1.89 | 0.49 | 1.10 | 0.85 | 1.87 | 3.70 |
| Others | 2.27 | 0.77 | 6.68 | 4.87 | 0.26 | 4.13 | 3.27 | 0.02 | 0.65 | 5.46 | 0.62 |
| Others | 0.44 | 4.16 | 4.34 | 2.77 | 0.84 | 3.34 | 2.17 | 0.87 | 0.41 | 2.85 | 2.92 |
Research Methodology
Related Databooks
March 2026
March 2026
April 2026
April 2026

 sales@precedenceresearch.com
 +1 804-441-9344
 Download Databook
 Schedule a Meeting