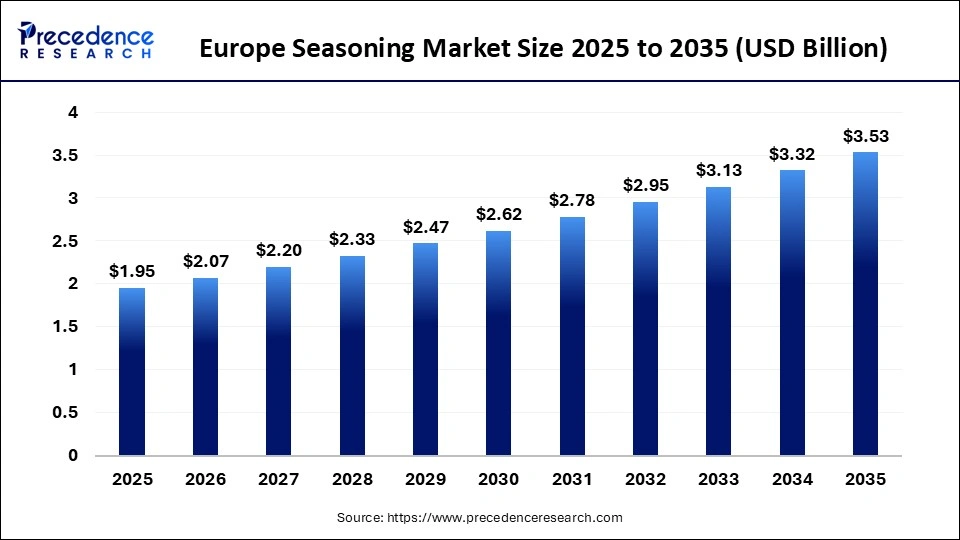
Europe Seasoning Market Size is USD 2.07 Billion in 2026
Europe Seasoning Market (By Product: Spices, Herbs, Salt & Salt Substitutes; By End-use: Retail, Foodservice; By Brand: National Brand, Private Label Brand) Industry Size, Share, Growth, Trends 2026 to 2035.


The Europe seasoning market size was estimated at USD 1.95 billion in 2025 and is expanding at a CAGR of 5.20% from 2026 to 2035. Growing demand for natural and organic flavors is driving the market.
Europe Seasoning Market Statical Scope
| Reports Attributes | Statistics |
| Market Size in 2025 | USD 1.95 Billion |
| Market Size in 2026 | USD 2.07 Billion |
| Market Size by 2035 | USD 3.53 Billion |
| CAGR 2026 to 2035 | 13.4% |
| Base Year | 2025 |
| Forecast Period | 2026 to 2035 |
The market for seasoning is experiencing increased demand due to shifting consumer preferences toward natural flavoring agents, alongside a growing interest in global cuisines. In the Europe, the food processing sector is a major user of spices and herbs to enhance the flavor of packaged foods, ready-to-eat meals, and snacks. Additionally, the rising popularity of plant-based and organic food options has further fueled this demand.
Europe Seasoning Market Share, By Country, 2025
Germany- The seasoning market in Germany is experiencing a transformation, driven by evolving consumer preferences and rising interest in culinary diversity. As consumer become more adventurous in their cooking, the demand for different seasonings is on the rise.
Europe Seasoning Market Share, By Product, 2025, (%)
| Segments | Shares (%) |
| Spices | 65% |
| Herbs | 20% |
| Salt & Salt Substitutes | 15% |
- Spices- the spices segment holds a 65% share of the market, due to extensive use in diverse cuisines and strong consumer demand for flavor enhancement.
- Herbs- rising demand for fresh, natural, and plant-based ingredients to avoid salt and fats, making herbs a preferred choice with 20% share.
- Salt and salt substitutes- demand is driven by rising health concerns, particularly hypertension, prompting a shift toward low-sodium alternatives with 15% share.
Europe Seasoning Market Share, By End Use, 2025, (%)
| Segments | Shares (%) |
| Retail | 78% |
| Foodservice | 22% |
- Retail- It dominates because of high household consumption and frequent purchases for daily cooking, contributing a 78 % share in the market.
- Foodservice- foodservice outlets have been widely using herbs and spices due to constantly changing food and beverage trends, and holds 22% share.
Europe Seasoning Market Share, By Brand, 2025, (%)
| Segments | Shares (%) |
| National Brand | 83% |
| Private Label | 17% |
- National brand- national brand holds 83% share of the market due to strong brand recognition, quality assurance, and wide distribution networks.
- Private label- private label brands are growing with 17% due to affordably priced products that offer good quality.
Top Companies in the Europe Seasoning Market
- Döhler GmbH
- Olam International
- Unilever
- Sensient Technologies Corporation
- Kerry Group plc.
- Prymat Group
- Nedspice Group
- Solina
- Euroma
- Schwartz
- British Pepper & Spice
Segments Covered in the Report
By Product
- Spices
- Pepper
- Ginger
- Cinnamon
- Cumin
- Turmeric
- Coriander
- Cardamom
- Cloves
- Others
- Herbs
- Garlic
- Oregano
- Mint
- Parsley
- Rosemary
- Fennel
- Others
- Salt & Salts Substitutes
By End-use
- Retail
- Foodservice
By Brand
- National Brand
- Private Label Brand
| End-use | 2025 | 2026 | 2027 | 2028 | 2029 | 2030 | 2031 | 2032 | 2033 | 2034 | 2035 |
|---|---|---|---|---|---|---|---|---|---|---|---|
| Retail | 60.50 | 61.00 | 61.50 | 62.00 | 62.50 | 63.00 | 63.50 | 64.00 | 64.50 | 65.00 | 65.50 |
| Foodservice | 39.50 | 39.00 | 38.50 | 38.00 | 37.50 | 37.00 | 36.50 | 36.00 | 35.50 | 35.00 | 34.50 |
| Brand | 2025 | 2026 | 2027 | 2028 | 2029 | 2030 | 2031 | 2032 | 2033 | 2034 | 2035 |
|---|---|---|---|---|---|---|---|---|---|---|---|
| National Brand | 70.20 | 70.50 | 70.80 | 71.00 | 71.20 | 71.50 | 71.70 | 71.90 | 72.10 | 72.30 | 72.50 |
| Private Label Brand | 29.80 | 29.50 | 29.20 | 29.00 | 28.80 | 28.50 | 28.30 | 28.10 | 27.90 | 27.70 | 27.50 |
Research Methodology
Related Databooks
March 2026
April 2026
April 2026
April 2026

 sales@precedenceresearch.com
 +1 804-441-9344
 Download Databook
 Schedule a Meeting