Europe Squalene Market Size is USD 66.45 Million in 2026
Europe Squalene Market (By Source: Animals, Plants, Synthetic; By End Use: Pharmaceuticals, Personal Care & Cosmetics, Nutraceuticals, Food & Beverages, Others) Industry Size, Share, Growth, Trends 2026 to 2035.


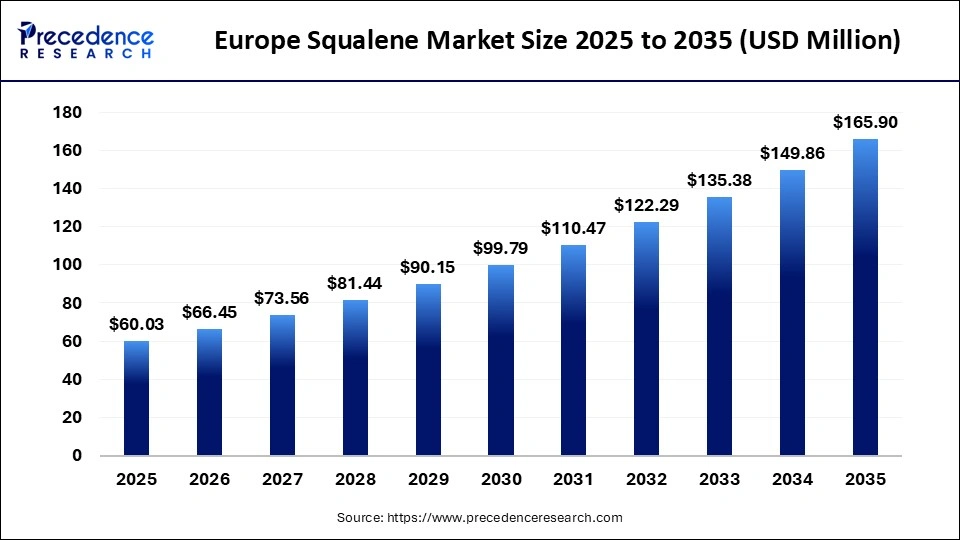
The Europe squalene market size was estimated at USD 60.03 million in 2025 and is expanding at a CAGR of 10.70% from 2026 to 2035. The growing demand for natural and sustainable products in the beauty and wellness industry is expanding the market in Europe.
Europe Squalene Market Statical Scope
| Reports Attributes | Statistics |
| Market Size in 2025 | USD 60.03 Million |
| Market Size in 2026 | USD 66.45 Million |
| Market Size by 2035 | USD 165.9 Million |
| CAGR 2026 to 2035 | 10.70% |
| Base Year | 2025 |
| Forecast Period | 2026 to 2035 |
Squalene is a naturally occurring organic compound primarily found in shark liver oil. However, it is also present in smaller amounts in some plant sources, such as olive oil, wheat germ, and amaranth seed. Recently, this compound has garnered attention for its potential health benefits and diverse applications in various industries.
The European squalene market is a thriving industry that includes the production and distribution of squalene, widely used in cosmetics, pharmaceuticals, and dietary supplements. The market is expected to grow in sourcing, formulation, and marketing of squalene, particularly in countries like France, Germany, and the UK, where the beauty and wellness industries are prominent.
Advancements in formulation technologies are enhancing the effectiveness of squalene in various applications, and ongoing research and development continue to drive market growth.
Europe Squalene Market Share, By Country, 2025
- Germany- In Germany, squalane consumption is projected to grow significantly. This growth is primarily fueled by pharmacy-grade cosmetics, certified natural skincare products, and regulated dermaceutical production. Squalane is used in barrier repair creams, post-treatment lotions, and fragrance-free moisturizers. Strict testing and documentation standards guide ingredient approval and supplier selection.
Europe Squalene Market Share, By Source, 2025, (%)
| Segments | Shares (%) |
| Animal | 47% |
| Plants | 38% |
| Synthetic | 15% |
- Animal - It dominates by holding a 47% share in the market, due to historically established extraction methods and high yield efficiency.
- Plants - Growing demand for vegan, sustainable, and cruelty-free products is driving this segment with 38% share.
- Synthetic - The synthetic segment holds 15% share due to the advancements in biotechnological processes.
Europe Squalene Market Share, By End Use, 2025, (%)
| Segments | Shares (%) |
| Personal care and cosmetics | 71% |
| Pharmaceuticals | 12% |
| Nutraceuticals | 8% |
| Food and beverages | 5% |
| Others | 4% |
- Personal care and cosmetics - It leads with a 71% share in the market, due to significant use in skincare and beauty formulations for moisturizing and anti-aging benefits, and demand for natural ingredients.
- Pharmaceuticals - It holds 12% share because of the therapeutic benefits of the squalene, and is also used in vaccines as an immunologic adjuvant.
- Nutraceuticals - the nutraceuticals segment accounts for 8% share, because of its antioxidant, immune-boosting, and cholesterol-lowering health benefits.
- Food and beverages - growing demand for functional foods is driving this segment with 5% share.
Top Companies in the Europe Squalene Market
- efpbiotek
- Gracefruit Limited.
- KURARAY CO., LTD.
- Maruha Nichiro Corporation
- Evonik Industries AG (Wilshire Technologies Inc.)
Segments Covered in the Report
By Source
- Animals
- Plants
- Synthetic
By End Use
- Pharmaceuticals
- Personal Care & Cosmetics
- Nutraceuticals
- Food & Beverages
- Others
| Source | 2025 | 2026 | 2027 | 2028 | 2029 | 2030 | 2031 | 2032 | 2033 | 2034 | 2035 |
|---|---|---|---|---|---|---|---|---|---|---|---|
| Animals | 26.41 | 68.64 | 178.26 | 462.71 | 1200.33 | 3111.89 | 8062.36 | 20873.65 | 54002.96 | 139605.14 | 360604.08 |
| Plants | 24.49 | 66.40 | 179.96 | 487.54 | 1320.37 | 3574.69 | 9674.83 | 26176.69 | 70803.88 | 191458.48 | 517572.91 |
| Synthetic | 9.12 | 24.58 | 66.21 | 178.31 | 480.13 | 1292.63 | 3479.54 | 9364.94 | 25201.38 | 67808.21 | 182423.24 |
| End Use | 2025 | 2026 | 2027 | 2028 | 2029 | 2030 | 2031 | 2032 | 2033 | 2034 | 2035 |
|---|---|---|---|---|---|---|---|---|---|---|---|
| Pharmaceuticals | 18.31 | 49.48 | 133.70 | 361.14 | 975.27 | 2633.14 | 7107.60 | 19181.19 | 51752.83 | 139605.14 | 376513.08 |
| Personal Care & Cosmetics | 20.77 | 54.59 | 143.46 | 376.94 | 990.27 | 2601.22 | 6831.79 | 17940.06 | 47102.58 | 123650.27 | 324543.67 |
| Nutraceuticals | 9.18 | 24.90 | 67.48 | 182.83 | 495.14 | 1340.51 | 3628.06 | 9816.26 | 26551.45 | 71796.93 | 194089.84 |
| Food & Beverages | 5.88 | 15.32 | 39.90 | 103.83 | 270.07 | 702.17 | 1824.64 | 4738.88 | 12300.67 | 31909.75 | 82726.82 |
| Others | 5.88 | 15.32 | 39.90 | 103.83 | 270.07 | 702.17 | 1824.64 | 4738.88 | 12300.67 | 31909.75 | 82726.82 |
Research Methodology
Related Databooks
March 2026
March 2026
April 2026
April 2026

 sales@precedenceresearch.com
 +1 804-441-9344
 Download Databook
 Schedule a Meeting