Middle East and Africa Popping Boba Market Size is USD 17.48 Million in 2026
Middle East and Africa Popping Boba Market (By Flavor: Fruit Flavors, Tea Flavors, Coffee Flavors, Chocolate Flavors, Others; By Application: Bubble Tea, Frozen Yogurt Toppings, Ice Cream Toppings, Smoothies and Beverages, Others; By Distribution Channel: Food Service, Retail, Supermarkets & Hypermarkets, Convenience Stores, Online, Others) Industry Size, Share, Growth, Trends 2026 to 2035.


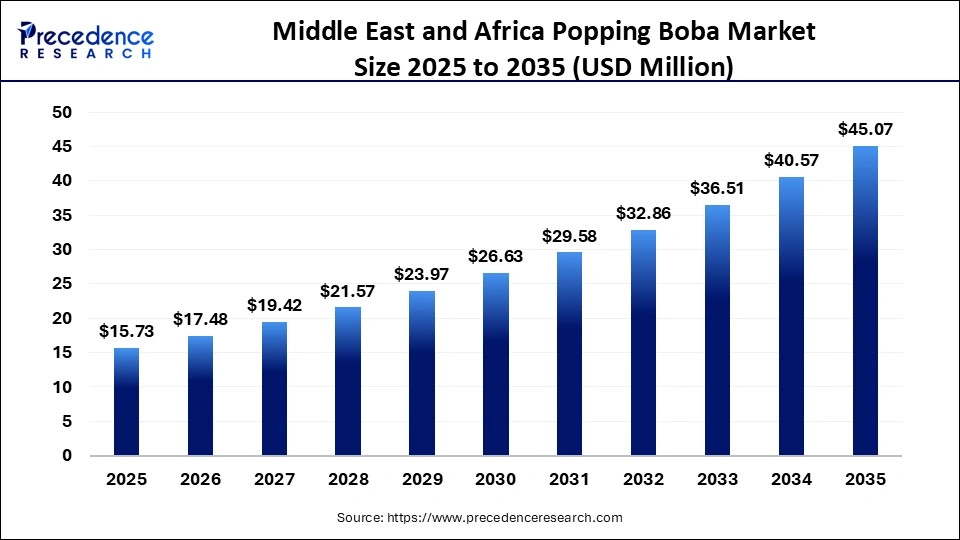
The Middle East & Africa popping boba market size was estimated at USD 15.73 million in 2025 and is expanding at a CAGR of 11% from 2026 to 2035. Due to rising youth demand for fun, trend-driven drinks and café culture, increasing disposable incomes, and a shift towards customizable flavor-rich beverages, wider availability through food service and retail also boosts adoption across urban centers.
Middle East and Africa Popping Boba Market Statical Scope
| Reports Attributes | Statistics |
| Market Size in 2025 | USD 15.73 Million |
| Market Size in 2026 | USD 17.48 Million |
| Market Size by 2035 | USD 45.07 Million |
| CAGR 2026 to 2035 | 11.1% |
| Base Year | 2025 |
| Forecast Period | 2026 to 2035 |
Technological advancements shaping the Middle East and Africa, the popping boba market revolves around improved production quality and versatility. Manufacturers are adopting automated equipment and better formulations that ensure consistent bead size, texture, and flavor delivery while enhancing shelf stability. They're growing use of natural juice. Reduced sugar recipes and health-oriented innovations to meet consumer demand for cleaner, functional ingredients .
Ready-to-serve and easy-to-prepare formats, along with more reliable storage and packaging solutions, are making popping boba easier for cafés, retailers, and home use, boosting regional adoption and variety.
Middle East and Africa Popping Boba Market Share, By Country, 2025 (%)
- UAE- Because it is gaining traction as part of the booming specialty beverage scene, especially in cosmopolitan cities like Dubai and Abu Dhabi, the bubble tea culture is expanding. Growing demand for unique Instagram-worthy drinks and creative café offers more shops to include popping boba toppings, helping diversify beverage choices and appeal to young trend Consumers.
- Saudi Arabia- Due to the expansion of bubble tea and trendy beverages culture gaining momentum among younger consumers, the demand is supported by rising disposable incomes, growing café and desserts segments, and increasing interest in innovative, flavorful drink experiences featuring popping boa toppings on teas, smoothies, and desserts. Market revenue in Saudi Arabia continues to rise with expected double-digit growth through this decade.
Middle East & Africa Popping Boba Market Share, By Flavor, 2025 (%)
| Segments | Shares (%) |
| Fruit Flavors | 66% |
| Tea Flavors | 12% |
| Coffee Flavors | 9% |
| Chocolate Flavors | 8% |
| Others | 5% |
- Fruit Flavors- The segment dominated the market with a 66% share, because consumers prefer refreshing and visually appealing fruit taste profiles like mango lichi and strawberry that pair well with bubble tea and beverages fitting local palates and café trends. This brought flavor appeal, and versatility in drinks and desserts drives its larger market share.
- Tea Flavors- The segment accounted for 12% of the total market share, due to consumers increasingly exploring classic and specialty keys like green, black, and match Often paired with popping boa for a balanced, less sweet beverage experience. This appeals to health-conscious and traditional tea drinkers, sustaining its niche but steady market presence.
- Coffee Flavors- The segment accounted for 9% of the total market share, due to consumers combining popping boba with a coffee-based drink, offering a unique textured twist to lattes and cold brews, attracting Café goers seeking innovative, flavorful beverages.
- Chocolate Flavors- The segment accounted for 8% of the total market share, due to Popping boba combined with chocolate beverages appeals to dessert lovers, offering rich, indulgent taste experiences in Café milkshakes and specialty drinks.
Middle East & Africa Popping Boba Market Share, By Application, 2025 (%)
| Segments | Shares (%) |
| Bubble Tea | 70% |
| Frozen Yogurt Toppings | 8% |
| Ice Cream Toppings | 9% |
| Smoothies & Beverages | 7% |
| Others | 6% |
| Others | 4% |
- Bubble Tea- The segment dominated the market with a 70% share, because it is most popular in bubble tea, driven by youth trends, café culture, and demand for customizable, visually appealing beverages.
- Frozen Yogurt Toppings- The segment accounted for 8% of the total market share, because it adds fun, fruity, and chewy textures to frozen desserts, attracting younger consumers and enhancing flavor and visual appeal.
- Ice Cream Toppings- The segment accounted for 9% of the total market share, because it enhances ice cream with chewy, making desserts more fun, visually appealing, and attractive to younger and novelty-seeking consumers.
- Smoothies & Beverages- The segment accounted for 7% of the total market share, because it adds a fun, flavorful texture to drinks, appealing to health-conscious and novelty-seeking consumers in café and retail outlets.
Middle East and Africa Popping Boba Market Share, By Distribution Channel, 2025 (%)
| Segments | Shares (%) |
| Food Service | 40% |
| Supermarkets & Hypermarkets | 20% |
| Convenience Stores | 15% |
| Online | 15% |
| Others | 10% |
- Food Service- The segment dominated the market with a 40% share, due to cafés, restaurants, and bubble tea shops. widely adapted popping boba to enhance beverages and desserts, attracting trend-focused consumers and boosting sales.
- Supermarkets & Hypermarkets- The segment accounted for 20% of the total market share, due to its ready-to-pop Boba products, which are increasingly available for home consumption, offering convenience and variety to consumers seeking trendy beverages and desserts.
- Convenience Stores- The segment accounted for 15% of the total market share, due to its offering of ready-to-drink and easy-to-use format, catering to busy consumers seeking quick, trendy, and favorite beverage options.
- Online- The segment accounted for 15% of the total market share, due to increasing purchases through e-commerce platforms offering convenience, wide flavor variety, and home delivery to meet growing consumer demand.
Top Companies in the Middle East and Africa Popping Boba Market
- IBUBBLE TEA
- Fresh Leaf UAE
- Golden Grains Foodstuff Trading LLC
- Tiger Boba
Segments Covered in the Report
By Flavor
- Fruit Flavors
- Tea Flavors
- Coffee Flavors
- Chocolate Flavors
- Others
By Application
- Bubble Tea
- Frozen Yogurt Toppings
- Ice Cream Toppings
- Smoothies and Beverages
- Others
By Distribution Channel
- Food Service
- Retail
- Supermarkets & Hypermarkets
- Convenience Stores
- Online
- Others
| Flavor | 2025 | 2026 | 2027 | 2028 | 2029 | 2030 | 2031 | 2032 | 2033 | 2034 | 2035 |
|---|---|---|---|---|---|---|---|---|---|---|---|
| Fruit Flavors | 5.64 | 6.27 | 6.96 | 7.73 | 8.59 | 9.55 | 10.61 | 11.78 | 13.09 | 14.54 | 16.16 |
| Tea Flavors | 3.15 | 3.50 | 3.89 | 4.32 | 4.80 | 5.33 | 5.92 | 6.58 | 7.31 | 8.12 | 9.03 |
| Coffee Flavors | 2.21 | 2.46 | 2.73 | 3.03 | 3.37 | 3.74 | 4.16 | 4.62 | 5.13 | 5.70 | 6.33 |
| Chocolate Flavors | 1.57 | 1.74 | 1.94 | 2.15 | 2.39 | 2.66 | 2.95 | 3.28 | 3.64 | 4.05 | 4.50 |
| Others (Flavor) | 3.16 | 3.51 | 3.90 | 4.33 | 4.81 | 5.35 | 5.94 | 6.60 | 7.33 | 8.15 | 9.05 |
| Application | 2025 | 2026 | 2027 | 2028 | 2029 | 2030 | 2031 | 2032 | 2033 | 2034 | 2035 |
|---|---|---|---|---|---|---|---|---|---|---|---|
| Bubble Tea | 7.11 | 7.90 | 8.78 | 9.75 | 10.83 | 12.03 | 13.37 | 14.85 | 16.50 | 18.34 | 20.37 |
| Frozen Yogurt Toppings | 2.36 | 2.62 | 2.91 | 3.24 | 3.60 | 3.99 | 4.44 | 4.93 | 5.48 | 6.09 | 6.76 |
| Ice Cream Toppings | 2.36 | 2.62 | 2.91 | 3.24 | 3.60 | 3.99 | 4.44 | 4.93 | 5.48 | 6.09 | 6.76 |
| Smoothies & Beverages | 2.36 | 2.62 | 2.91 | 3.24 | 3.60 | 3.99 | 4.44 | 4.93 | 5.48 | 6.09 | 6.76 |
| Others (Application) | 1.54 | 1.71 | 1.90 | 2.11 | 2.35 | 2.61 | 2.90 | 3.22 | 3.57 | 3.97 | 4.41 |
Research Methodology
Related Databooks
March 2026
April 2026
April 2026
April 2026

 sales@precedenceresearch.com
 +1 804-441-9344
 Download Databook
 Schedule a Meeting