Middle East Refractories Market Size is USD 1.25 Billion in 2026
Middle East Refractories Market (By End Use: Iron & Steel, Cement & Lime, Glass & Ceramics, Non-Ferrous Metals, Others) Industry Size, Share, Growth, Trends 2026 to 2035.


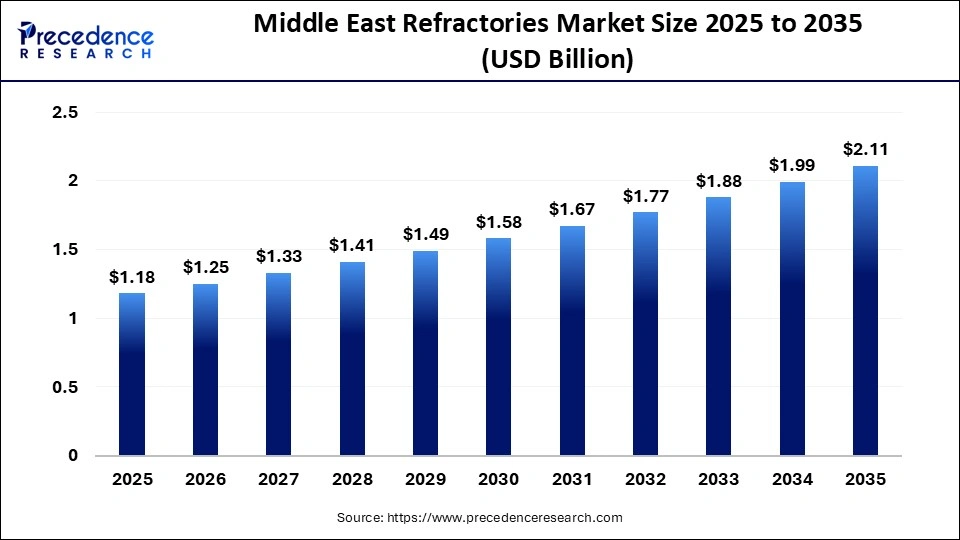
The Middle East refractories market size was estimated at USD 1.18 billion in 2025 and is predicted to increase from USD 1.25 billion in 2026 to approximately USD 2.11 billion by 2035, expanding at a CAGR of 6% from 2026 to 2035. Driven by rapid industrialization, increasing steel and cement production, and strong infrastructure development, rising investment in energy, along with demand for durable high-temperature materials, are factors excluding market growth.
Middle East Refractories Market Statical Scope
| Reports Attributes | Statistics |
| Market Size in 2025 | USD 1.18 Billion |
| Market Size in 2026 | USD 1.25 Billion |
| Market Size by 2035 | USD 2.11 Billion |
| CAGR 2026 to 2035 | 6% |
| Base Year | 2025 |
| Forecast Period | 2026 to 2035 |
Technological advancements are reshaping the Middle East refractories market through the adaptation of high-performance materials, improved manufacturing processes, and digital monitoring systems. Innovations such as nanotechnology-based refractories, energy-efficient production techniques, and smart sensors for real-time performance are enhancing durability and reducing maintenance costs. Additionally, automation and data-driven quality control are helping manufacturers improve consistency, optimize operations, and meet the growing demand from the steel and cement.
Middle East Refractories Market Share, By Country, 2025 (%)
UAE - Due to rapid infrastructure development, rising steel and cement production, and expanding industrial activities, strong investments in construction, energy, and manufacturing sectors are significantly increasing demand for high-temperature refractory materials.
Saudi Arabia - Due to strong investments in steel and cement, along with large-scale infrastructure projects and rapid industrialization, which significantly increase demand for high-temperature resistant materials.
Middle East Refractories Market Share, By End Use, 2025 (%)
| Segments | Shares (%) |
| Iron & Steel | 65% |
| Cement & Lime | 12% |
| Glass & Ceramics | 8% |
| Non- Ferrous Metals | 10% |
| Others | 5% |
- Iron & Steel- The segment dominated the market with a 65% share, due to its high consumption of refractories in furnaces, kilns, and ladles. Continuous steel production, increasing infrastructure demand, and the need for heat-resistant materials significantly drive growth in this segment.
- Cement & Lime- The segment accounted for 12% of the total market share, driven by steady construction activity and ongoing infrastructure development, which continues to support consistent demand for refractory materials in high-temperature processing applications.
- Glass & Ceramics- The segment accounted for 8% of the total market share, due to steady demand in manufacturing, while the minerals segment also contributed modestly due to its role in high-temperature processing across specialized industrial applications.
- Non- Ferrous Metals- The segment accounted for 10% of the total market share. Due to growing demand for aluminum and copper production, while other smaller segments maintain a limited presence due to comparatively lower consumption of refractory materials.
- Others- Includes various additional conditions, with a 5% share, result in moderate contribution.
Top Companies in the Middle East Refractories Market
- Al Karawan Group of Companies
- Almatis
- Industrial Ceramics Middle East (ICLME)
- Isolite Insulating Products
- Luyang Energy Saving Materials
- Pennekamp Middle East LLC
- Rath Group
- Saint Gobain
- Unifrax
Segments Covered in the Report
By End Use
- Iron & Steel
- Cement & Lime
- Glass & Ceramics
- Non-Ferrous Metals
- Others
| End Use | 2025 | 2026 | 2027 | 2028 | 2029 | 2030 | 2031 | 2032 | 2033 | 2034 | 2035 |
|---|---|---|---|---|---|---|---|---|---|---|---|
| Iron & Steel | 0.76 | 0.79 | 0.83 | 0.87 | 0.92 | 0.99 | 1.03 | 1.08 | 1.14 | 1.19 | 1.29 |
| Cement & Lime | 0.20 | 0.21 | 0.23 | 0.24 | 0.26 | 0.27 | 0.29 | 0.31 | 0.33 | 0.35 | 0.37 |
| Glass & Ceramics | 0.09 | 0.10 | 0.11 | 0.12 | 0.13 | 0.15 | 0.17 | 0.19 | 0.21 | 0.23 | 0.24 |
| Non-Ferrous Metals | 0.07 | 0.08 | 0.09 | 0.09 | 0.10 | 0.10 | 0.11 | 0.12 | 0.13 | 0.14 | 0.15 |
| Others | 0.06 | 0.07 | 0.07 | 0.08 | 0.09 | 0.08 | 0.09 | 0.09 | 0.09 | 0.10 | 0.08 |

 sales@precedenceresearch.com
 +1 804-441-9344
 Download Databook
 Schedule a Meeting