Middle East Seafood Packaging Market Size is USD 743.29 Million in 2026
Middle East Seafood Packaging Market (By Material: Plastic, Paper & Paperboard, Metal, Others; By Packaging Technology: MAP, Vacuum Skin Packaging, Others; By Seafood Type: Fish, Mollusca, Crustaceans, Others; By Packaging Format: Trays, Bags & Pouches, Cans, Boxes, Shrink Films, Others; By Application: Fresh & Frozen, Processed) Industry Size, Share, Growth, Trends 2026 to 2035.


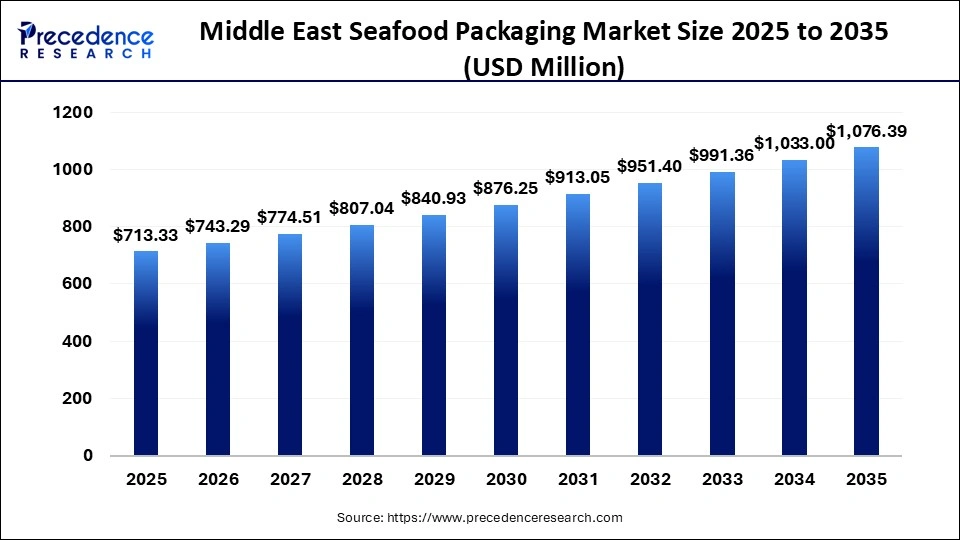
The Middle East seafood packaging market size was estimated at USD 713.33 million in 2025 and is expanding at a CAGR of 4.2% from 2026 to 2035. Growing seafood consumption and trade are driving the market.
Middle East Seafood Packaging Market Statical Scope
| Reports Attributes | Statistics |
| Market Size in 2025 | USD 713.33 Million |
| Market Size in 2026 | USD 743.29 Million |
| Market Size by 2035 | USD 1,076.39 Million |
| CAGR 2026 to 2035 | 4.2% |
| Base Year | 2025 |
| Forecast Period | 2026 to 2035 |
The Middle East seafood packaging market focuses on packaging seafood products, including fresh fish, frozen seafood, shellfish, and processed seafood, for distribution, retail sale, food service, and export across the region. This market encompasses various materials, packaging technologies, and formats designed to protect seafood quality.
As consumers increasingly prioritize protein-rich diets, seafood has emerged as a healthier alternative to red meat, resulting in rising demand for efficient and sustainable packaging solutions. For example, countries like the UAE and Saudi Arabia, with rapid urban population growth and a high expatriate presence, have seen a surge in seafood consumption, necessitating advanced packaging to extend shelf life and maintain quality.
Middle East Seafood Packaging Market Share, By Country, 2025
- UAE- The UAE leads in seafood packaging innovation due to its status as a global trade hub and high seafood consumption. Dubai's Jebel Ali Port facilitates seafood imports and exports, requiring high-barrier packaging to ensure freshness.
Middle East Seafood Packaging Market Share, By Material, 2025 (%)
| Segments | Shares (%) |
| Plastic | 51% |
| Paper & Paperboard | 34% |
| Metal | 15% |
- Plastic- It dominates with 51% share of material usage due to durability and moisture resistance, and is widely used in seafood packaging.
- Paper and paperboard- Rising demand for sustainable, recyclable, and plastic-free alternatives is driving this segment with a share of 34%.
- Metal- strong barrier properties, durability, and sustainability, along with demand for shelf-stable products like tuna and sardines, drive the segment growth and contribute to 15% share.
Middle East Seafood Packaging Market Share, By Packaging Technology, 2025 (%)
| Segments | Shares (%) |
| Vacuum Skin Packaging (VSP) | 46% |
| Modified Atmosphere Packaging (MAP) | 54% |
- Vacuum Skin Packaging (VSP)- It drives packaging technology demand due to product preservation and, with a 46% share, is widely used for seafood freshness.
- Modified Atmosphere Packaging (MAP)- This segment is growing due to its ability to extend shelf life by changing internal gas compositions, which accounts for 54% share.
Middle East Seafood Packaging Market Share, By Seafood Type, 2025 (%)
| Segments | Shares (%) |
| Fish | 55% |
| Mollusca | 20% |
| Crustaceans | 25% |
- Fish- It drives the largest seafood packaging demand and, with a 55% share, is due to strong consumption and volume.
- Mollusca- Mollusca segment accounts for 20% share due to the rising demand for scallops, oysters, squids, octopuses, and clams.
- Crustaceans- The crustaceans segment holds 25% share, driven by strong demand for shrimp, crab, and lobster.
Middle East Seafood Packaging Market Share, By Packaging Format, 2025 (%)
| Segments | Shares (%) |
| Trays | 27% |
| Bags & Pouches | 21% |
| Cans | 18% |
| Boxes | 34% |
- Trays- They are widely used for portioning and display due to convenience in storage, leading seafood packaging formats with a 27 share.
- Bags and Pouches- this segment holds 21% market share due to lightweight, flexible, and consumer-friendly seafood packaging formats.
- Cans- Growing demand for canned seafood also means that cans offer exceptional protection against light, air, and moisture, holds 18% share.
- Boxes- Rising component focused on storing and transporting seafood, driving the demand for boxes, and holds 34%.
Middle East Seafood Packaging Market Share, By Application, 2025 (%)
| Segments | Shares (%) |
| Fresh & Frozen | 70% |
| Processed | 30% |
- Fresh & Frozen- It drives the largest market demand, with a 70% share, and is propelled by high consumer preference for fresh seafood.
- Processed- Growing demand for frozen, processed, and ready-to-eat seafood is driving the segment growth and holds 30% share.
Top Companies in the Middle East Seafood Packaging Market
- DS Smith
- Swiss Pac UAE
- Amber Packaging
- ENPI Group
- TecPak
- Shuaiba Industrial Co.
- PLASTOPIL
- Sealed Air
- Amcor plc
- ULMA Packaging
Segments Covered in the Report
By Material
- Plastic
- Paper & Paperboard
- Metal
- Others
By Packaging Technology
- MAP
- Vacuum Skin Packaging
- Others
By Seafood Type
- Fish
- Mollusca
- Crustaceans
- Others
By Packaging FormatTrays
- Bags & Pouches
- Cans
- Boxes
- Shrink Films
- Others
By Application
- Fresh & Frozen
- Processed
Middle East Seafood Packaging Market Size, By Application, 2025 to 2035 (USD Million)
| Application | 2025 | 2026 | 2027 | 2028 | 2029 | 2030 | 2031 | 2032 | 2033 | 2034 | 2035 |
|---|---|---|---|---|---|---|---|---|---|---|---|
| Fresh & Frozen | 499.33 | 516.59 | 534.41 | 552.82 | 571.83 | 591.47 | 611.74 | 632.68 | 654.30 | 676.62 | 699.65 |
| Processed | 214.00 | 226.70 | 240.10 | 254.22 | 269.10 | 284.78 | 301.31 | 318.72 | 337.06 | 356.38 | 376.74 |
Middle East Seafood Packaging Market Size, By Packaging Format, 2025 to 2035 (USD Million)
| Packaging Format | 2025 | 2026 | 2027 | 2028 | 2029 | 2030 | 2031 | 2032 | 2033 | 2034 | 2035 |
|---|---|---|---|---|---|---|---|---|---|---|---|
| Trays | 192.60 | 199.20 | 206.02 | 213.06 | 220.32 | 227.82 | 235.57 | 243.56 | 251.81 | 260.32 | 269.10 |
| Bags & Pouches | 149.80 | 158.32 | 167.29 | 176.74 | 186.69 | 197.16 | 208.18 | 219.77 | 231.98 | 244.82 | 258.33 |
| Cans | 128.40 | 133.05 | 137.86 | 142.85 | 148.00 | 153.34 | 158.87 | 164.59 | 170.51 | 176.64 | 182.99 |
| Boxes | 242.53 | 252.72 | 263.33 | 274.39 | 285.92 | 297.93 | 310.44 | 323.48 | 337.06 | 351.22 | 365.97 |

 sales@precedenceresearch.com
 +1 804-441-9344
 Download Databook
 Schedule a Meeting