North America Biochar Market Size is USD 432.1 Million in 2026
North America Biochar Market (By Technology: Pyrolysis, Gasification, Others; By Application: Agriculture, Animal Feed, Health & Beauty Products, Other Applications) Industry Size, Share, Growth, Trends 2026 to 2035.


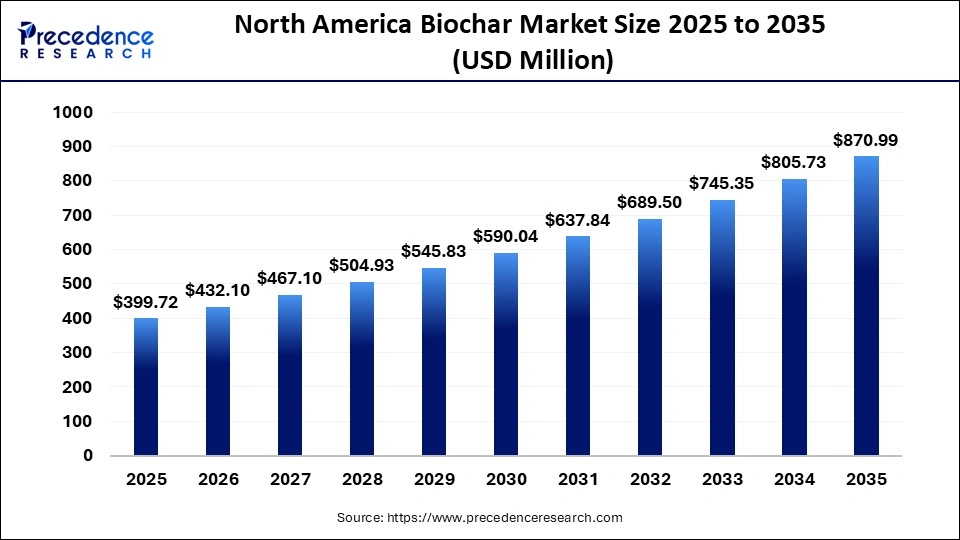
The North America biochar market is expected to grow from USD 399.72 million in 2025, with a satisfying CAGR of 8.1%. Due to increasing demand for soil enhancement, carbon sequestration, improved crop productivity, sustainable farming practices, and health benefits, and adoption in niche Applications like cosmetics and environmental management.
North America Biochar Market Statical Scope
| Reports Attributes | Statistics |
| Market Size in 2025 | USD 399.72 Million |
| Market Size in 2026 | USD 432.1 Million |
| Market Size by 2035 | USD 870.99 Million |
| CAGR 2026 to 2035 | 8.10% |
| Base Year | 2025 |
| Forecast Period | 2026 to 2035 |
The North America biochar market relies on advanced technologies for efficient biomass conversion, energy recovery, and large-scale production. While these technologies improve process efficiency and product quality, risks remain, including high initial investment costs, limited scalability of emerging methods, and variable feeds to quality regulatory uncertainties and inconsistent standards for biochar application can also affect adoption.
Complexity may pose operational challenges for small-scale producers. Continuous innovation and standardisation are crucial to mitigate this risk and ensure sustainable growth in the biochar industry.
North America Biochar Market Share, By Technology, 2025 (%)
| Segments | Shares (%) |
| Pyrolysis | 66% |
| Gasification | 24% |
| Others | 10% |
- Pyrolysis- The segment dominated the market with a 66% share, leading due to high conversion efficiency, widespread use, and mature production infrastructures.
- Gasification- The segment accounted for 24% of the total market share. Its growth is driven by improved process efficiency and added energy recovery, boosting its appeal in advanced biochar production systems.
- Others- The segment accounted for 10% of the total market share. This segment includes new technologies with limited adoption and commercial reach.
North America Biochar Market Share, By Application, 2025 (%)
| Segments | Shares (%) |
| Agriculture | 80% |
| Animal Feed | 9% |
| Health & Beauty Products | 6% |
| Other Applications | 5% |
- Agriculture- The segment dominated the market with a 80% share. It leads due to its benefits in soil improvement, carbon storage, and boosting crop yields, enhancing its value in modern agriculture.
- Animal Feed- The segment accounted for 9% of the total market share. It is gaining traction as a natural solution to improve digestion and promote healthier livestock.
- Health & Beauty Products- The segment accounted for 6% of the total market share. It is valued for specific applications in cosmetic and skin care.
- Other Applications- The segment accounted for 5% of the total market share. Its use is limited, yet emerging demands suggest gradual adoption.
Top Companies in the North America Biochar Market
- Black Owl Biochar
- Karr Group
- Aries Clean Technologies
- Pacific Biochar Benefit Corporation
- Advance Renewable Technology International (ARTI)
- Soil Reef LLC
- Biochar Now
- Oregon Biochar Solutions
- New England Biochar
- CharGrow
- Strategic Environmental & Energy Resources, Inc.
- Airex Energy
Segments Covered in the Report
By Technology
- Pyrolysis
- Gasification
- Others
By Application
- Agriculture
- Animal Feed
- Health & Beauty Products
- Other Applications
| Technology | 2025 | 2026 | 2027 | 2028 | 2029 | 2030 | 2031 | 2032 | 2033 | 2034 | 2035 |
|---|---|---|---|---|---|---|---|---|---|---|---|
| Pyrolysis | 179.87 | 194.44 | 210.19 | 227.22 | 245.62 | 265.52 | 287.03 | 310.28 | 335.41 | 362.58 | 391.95 |
| Gasification | 139.90 | 151.23 | 163.48 | 176.73 | 191.04 | 206.52 | 223.24 | 241.33 | 260.87 | 282.00 | 304.85 |
| Others | 79.94 | 86.42 | 93.42 | 100.99 | 109.17 | 118.01 | 127.57 | 137.90 | 149.07 | 161.15 | 174.20 |
| Total | 399.72 | 432.10 | 467.10 | 504.93 | 545.83 | 590.04 | 637.84 | 689.50 | 745.35 | 805.73 | 870.99 |
| Application | 2025 | 2026 | 2027 | 2028 | 2029 | 2030 | 2031 | 2032 | 2033 | 2034 | 2035 |
|---|---|---|---|---|---|---|---|---|---|---|---|
| Agriculture | 159.89 | 172.84 | 186.84 | 201.97 | 218.33 | 236.02 | 255.13 | 275.80 | 298.14 | 322.29 | 348.40 |
| Animal Feed | 59.96 | 64.81 | 70.06 | 75.74 | 81.87 | 88.51 | 95.68 | 103.43 | 111.80 | 120.86 | 130.65 |
| Health & Beauty Products | 99.93 | 108.02 | 116.77 | 126.23 | 136.46 | 147.51 | 159.46 | 172.38 | 186.34 | 201.43 | 217.75 |
| Other Applications | 79.94 | 86.42 | 93.42 | 100.99 | 109.17 | 118.01 | 127.57 | 137.90 | 149.07 | 161.15 | 174.20 |
| Total | 399.72 | 432.10 | 467.10 | 504.93 | 545.83 | 590.04 | 637.84 | 689.50 | 745.35 | 805.73 | 870.99 |
Research Methodology
Related Databooks
March 2026
March 2026
April 2026
April 2026

 sales@precedenceresearch.com
 +1 804-441-9344
 Download Databook
 Schedule a Meeting