North America Polyurethane Market Size is USD 23.28 Billion in 2026
North America Polyurethane Market (By Product: Rigid Foam, Flexible Foam, Coatings, Adhesives & Sealants, Elastomers, Others; By End Use: Furniture and Interiors, Construction, Electronics & Appliances, Automotive, Footwear, Packaging, Others) Industry Size, Share, Growth, Trends 2026 to 2035.


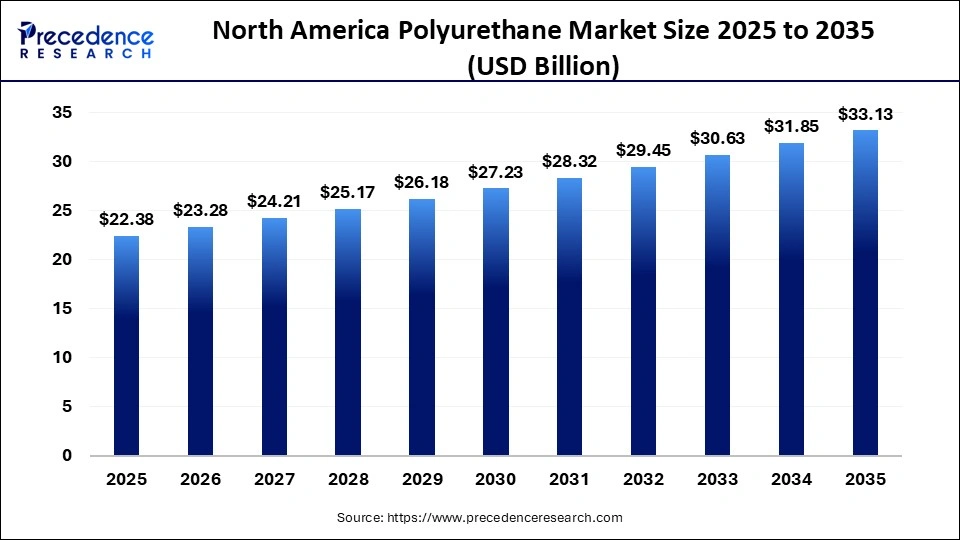
The North America polyurethane market size was estimated at USD 22.38 billion in 2025 and is predicted to increase from USD 23.28 billion in 2026 to approximately USD 33.13 billion by 2035, expanding at A CAGR of 4% from 2026 to 2035. The market is rapidly expanding globally, driven by the demand for lightweight and durable materials in construction, automotive, furniture, and electronics.
North America Polyurethane Market Statical Scope
| Reports Attributes | Statistics |
| Market Size in 2025 | USD 22.38 Billion |
| Market Size in 2026 | USD 23.28 Billion |
| Market Size by 2035 | USD 33.13 Billion |
| CAGR 2026 to 2035 | 4% |
| Base Year | 2025 |
| Forecast Period | 2026 to 2035 |
The polyurethane market is crucial due to its versatility, serving key industries like construction, automotive, and furniture. It enhances energy efficiency with thermal insulation, reduces transportation weight for better fuel efficiency, and provides durable cushioning in consumer products. Polyurethane's rigid foam offers excellent thermal insulation for buildings, meeting energy standards, and is essential for sealants, adhesives, and coatings.
Its demand is high for lightweight vehicle components, providing high-performance materials for seats, dashboards, and bumpers. Additionally, it is widely used in furniture, bedding, footwear, and packaging for comfort and shock absorption. The industry is increasingly focusing on sustainability, emphasizing bio-based polyurethanes and energy-saving applications. Rigid foam is also critical for modern refrigerators and freezers, delivering superior thermal insulation compared to polystyrene.
North America Polyurethane Market, By Country 2025 (%)
- U.S. – The U.S. market is driven by the demand for durable, energy-efficient insulation in construction and lightweight materials in the automotive sector for better fuel efficiency and electric vehicle range.
- Canada – The Canadian market is shaped by the rising need for lightweight, energy-efficient materials in construction and automotive, alongside growth in furniture and packaging applications.
- Mexico – The Mexican market is mainly driven by growth in the construction and automotive sectors, the demand for lightweight materials in electric vehicles, and urbanization, boosting furniture and bedding sales.
North America Polyurethane Market Share, By Product, 2025 (%)
| Segments | Shares (%) |
| Rigid Foam | 35% |
| Flexible Foam | 22% |
| Coatings | 14% |
| Adhesives & Sealants | 12% |
- Rigid Foam – This segment dominates with 35% owing to its widespread application in insulation within the construction and refrigeration sectors, providing high energy efficiency and durability.
- Flexible Foam - This segment is gaining traction with 22% as the demand increases in furniture, bedding, and automotive seating applications, propelled by the need for comfort and cushioning.
- Coatings - This segment, comprising 14% of the share, is widely used for both protective and decorative purposes in many industries.
- Adhesives & Sealants - This segment, making up 12% share, plays a crucial role in bonding and sealing tasks in the construction and manufacturing sectors.
North America Polyurethane Market Share, By Category, 2025 (%)
| Segments | Shares (%) |
| Construction | 30% |
| Furniture and Interiors | 22% |
| Electronics & Appliances | 22% |
| Automotive | 13% |
| Product | 2025 | 2026 | 2027 | 2028 | 2029 | 2030 | 2031 | 2032 | 2033 | 2034 | 2035 |
|---|---|---|---|---|---|---|---|---|---|---|---|
| Rigid Foam | 6.71 | 6.98 | 7.26 | 7.55 | 7.85 | 8.17 | 8.50 | 8.84 | 9.19 | 9.56 | 9.94 |
| Flexible Foam | 6.27 | 6.52 | 6.78 | 7.05 | 7.33 | 7.62 | 7.93 | 8.25 | 8.58 | 8.92 | 9.28 |
| Coatings | 2.69 | 2.79 | 2.90 | 3.02 | 3.14 | 3.27 | 3.40 | 3.53 | 3.68 | 3.82 | 3.98 |
| Adhesives & Sealants | 2.24 | 2.33 | 2.42 | 2.52 | 2.62 | 2.72 | 2.83 | 2.95 | 3.06 | 3.19 | 3.31 |
| Elastomers | 1.79 | 1.86 | 1.94 | 2.01 | 2.09 | 2.18 | 2.27 | 2.36 | 2.45 | 2.55 | 2.65 |
| Others | 2.69 | 2.79 | 2.90 | 3.02 | 3.14 | 3.27 | 3.40 | 3.53 | 3.68 | 3.82 | 3.98 |
| End Use | 2025 | 2026 | 2027 | 2028 | 2029 | 2030 | 2031 | 2032 | 2033 | 2034 | 2035 |
|---|---|---|---|---|---|---|---|---|---|---|---|
| Furniture & Interiors | 4.03 | 4.19 | 4.36 | 4.53 | 4.71 | 4.90 | 5.10 | 5.30 | 5.51 | 5.73 | 5.96 |
| Construction | 6.27 | 6.52 | 6.78 | 7.05 | 7.33 | 7.62 | 7.93 | 8.25 | 8.58 | 8.92 | 9.28 |
| Electronics & Appliances | 2.69 | 2.79 | 2.90 | 3.02 | 3.14 | 3.27 | 3.40 | 3.53 | 3.68 | 3.82 | 3.98 |
| Automotive | 4.48 | 4.66 | 4.84 | 5.03 | 5.24 | 5.45 | 5.66 | 5.89 | 6.13 | 6.37 | 6.63 |
| Footwear | 0.90 | 0.93 | 0.97 | 1.01 | 1.05 | 1.09 | 1.13 | 1.18 | 1.23 | 1.27 | 1.33 |
| Packaging | 2.24 | 2.33 | 2.42 | 2.52 | 2.62 | 2.72 | 2.83 | 2.95 | 3.06 | 3.19 | 3.31 |
| Others | 1.79 | 1.86 | 1.94 | 2.01 | 2.09 | 2.18 | 2.27 | 2.36 | 2.45 | 2.55 | 2.65 |

 sales@precedenceresearch.com
 +1 804-441-9344
 Download Databook
 Schedule a Meeting