U.S. Biscuits Market Size is USD 24.15 Billion in 2026
U.S. Biscuits Market (By Type: Organized, Unorganized; By Product: Cookies, Filled/Coated Biscuits, Crackers, Cream Wafers, Others; By Source: Oats, Wheat, Millets, Others; By Distribution Channel: Specialist Retail Stores, E-commerce, Convenience Stores, Supermarkets, Others) Industry Size, Share, Growth, Trends 2026 to 2035.


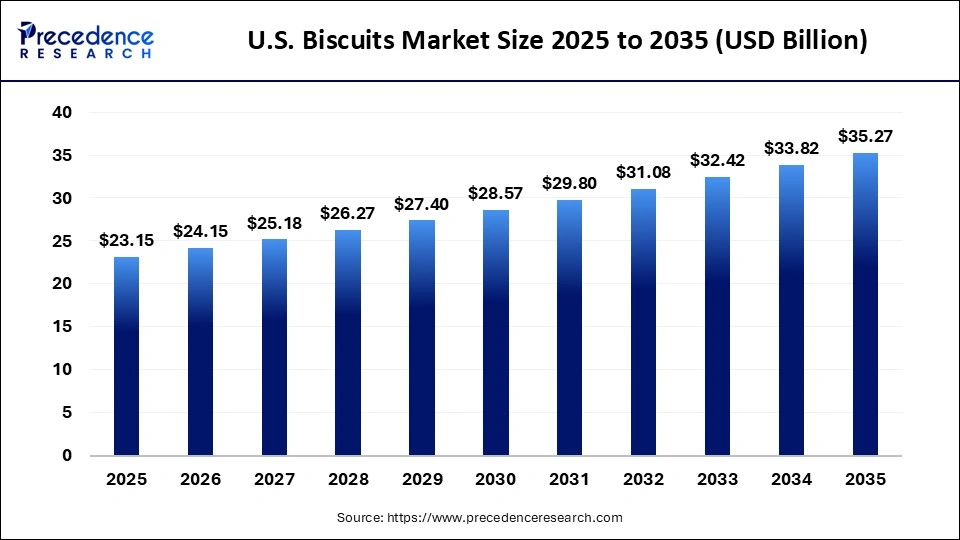
The U.S. biscuits market size was estimated at USD 23.15 billion in 2025 and is predicted to increase from USD 24.15 billion in 2026 to approximately USD 35.27 billion by 2035, expanding at a CAGR of 4.3% from 2026 to 2035. Demand for healthy and on-the-go snacks is driving the market in the U.S.
U.S. Biscuits Market Statical Scope
| Reports Attributes | Statistics |
| Market Size in 2025 | USD 23.15 Billion |
| Market Size in 2026 | USD 24.15 Billion |
| Market Size by 2035 | USD 35.27 Billion |
| CAGR 2026 to 2035 | 4.3% |
| Base Year | 2025 |
| Forecast Period | 2026 to 2035 |
The U.S. biscuits market encompasses the manufacturing, distribution, and consumption of a diverse range of biscuit varieties, including cookies, crackers, filled biscuits, and cream wafers. The term biscuit, derived from the Latin biscoctus, meaning twice-cooked or baked, has its origins in Roman times, when certain foods required thorough drying for extended shelf life. In a global context, and specifically within the U.S., biscuits, cookies, and crackers are categorized as chemically leavened bread products and are widely utilized.
The growth of the biscuit market in the U.S. is driven by robust consumer demand and significant product penetration. Factors contributing to this expansion include the increasing consumer preference for convenient snack options and a rising trend towards healthier ingredients. Regulatory support for food safety and labeling has further stimulated market growth by ensuring adherence to high-quality standards.
U.S. Biscuits Market Share, By Type, 2025 (%)
| Segments | Shares (%) |
| Organized | 79% |
| Unorganized | 21% |
- Organized- The organized segment, possessing a strong brand presence, quality assurance, and extensive distribution networks, commands a 79% market share, establishing it as the dominant segment within the biscuits market.
- Unorganized- the unorganized segment, characterized by a growing demand for local and affordable products, holds a 21% share and is experiencing rapid growth.
U.S. Biscuits Market Share, By Product, 2025 (%)
| Segments | Shares (%) |
| Cookies | 38% |
| Filled/Coated Biscuits | 22% |
| Crackers | 18% |
| Cream Wafers | 12% |
| Others | 10% |
- Cookies - Cookies lead the market with a 38% share, driven by consumer preference for flavor variety and convenient snacking.
- Filled/Coated Biscuits - The filled or coated biscuits segment, accounting for 22%, is witnessing accelerated growth due to increasing demand for premium and innovative flavors.
- Crackers - The crackers segment holds an 18% share and is steadily consumed as a light snack, with heightened consumption attributed to the growing inclination toward home entertainment and packaging innovations.
- Crème wafers - The Crème wafers segment is spurred by consumer demand for indulgent, on-the-go snacks, holds a 12% market share, and is growing rapidly.
U.S. Textile Market Share, By Source, 2025 (%)
| Segments | Shares (%) |
| Oats | 18% |
| Wheat | 62% |
| Millets | 10% |
| Others | 10% |
- Wheat - Wheat dominates the market with a 62% share, bolstered by its widespread availability and consumer preference for traditional ingredients.
- Millets - The millets segment is reflecting a rising focus on health and nutrition, accounting for 10%, and is experiencing swift growth.
- Oats - The oats segment is in growing demand due to health awareness, maintaining an 18% share, remaining secondary to wheat-based products.
- Others - Includes various smaller retail formats, with a 12% share, result in moderate contribution.
U.S. Textile Market Share, By Distribution Channel, 2025 (%)
| Segments | Shares (%) |
| Supermarkets | 42% |
| E-commerce | 16% |
| Convenience Stores | 18% |
| Specialist retail stores | 14% |
| Others | 10% |
- Supermarkets- Supermarkets lead the distribution channel with a 42% share, driven by wide product availability, strong visibility, and consumer convenience.
- E-commerce - The e-commerce segment represents a 16% share, benefits from increasing online shopping trends, and the convenience of home delivery.
- Convenience stores- Convenience stores hold an 18% share, and cater to consumers seeking quick purchase options.
- Specialist retail stores - Specialist retail stores, addressing niche consumer demands for premium, artisanal, and health-focused products, capture a 14% market share.
- Others - Includes various smaller retail formats, with a 10% share, result in moderate contribution.
Top Companies in the U.S. Biscuits Market
- Mondelēz International
- Britannia Industries
- Kellanova
- United Biscuits
- PARLE
- General Mills Inc.
- Nestlé
- The Campbell's Company
- Ferrero
- PARTNERS
Segments Covered in the Report
By Type
- Organized
- Unorganized
By Product
- Cookies
- Filled/Coated Biscuits
- Crackers
- Cream Wafers
- Others
By Source
- Oats
- Wheat
- Millets
- Others
By Distribution Channel
- Specialist Retail Stores
- E-commerce
- Convenience Stores
- Supermarkets
- Others
| Type | 2025 | 2026 | 2027 | 2028 | 2029 | 2030 | 2031 | 2032 | 2033 | 2034 | 2035 |
|---|---|---|---|---|---|---|---|---|---|---|---|
| Organized | 15.74 | 16.52 | 17.33 | 18.18 | 19.07 | 20.00 | 20.98 | 22.01 | 23.08 | 24.21 | 25.39 |
| Unorganized | 7.41 | 7.63 | 7.86 | 8.09 | 8.33 | 8.57 | 8.82 | 9.08 | 9.34 | 9.60 | 9.88 |
| Product | 2025 | 2026 | 2027 | 2028 | 2029 | 2030 | 2031 | 2032 | 2033 | 2034 | 2035 |
|---|---|---|---|---|---|---|---|---|---|---|---|
| Cookies | 6.02 | 6.33 | 6.65 | 6.99 | 7.34 | 7.72 | 8.11 | 8.52 | 8.95 | 9.40 | 9.88 |
| Filled/Coated Biscuits | 4.17 | 4.37 | 4.58 | 4.81 | 5.04 | 5.29 | 5.54 | 5.81 | 6.10 | 6.39 | 6.70 |
| Crackers | 6.95 | 7.17 | 7.40 | 7.64 | 7.89 | 8.14 | 8.40 | 8.67 | 8.95 | 9.23 | 9.52 |
| Cream Wafers | 3.24 | 3.41 | 3.58 | 3.76 | 3.95 | 4.14 | 4.35 | 4.57 | 4.80 | 5.04 | 5.29 |
| Others | 2.78 | 2.87 | 2.97 | 3.07 | 3.18 | 3.29 | 3.40 | 3.51 | 3.63 | 3.75 | 3.88 |
Research Methodology
Related Databooks
March 2026
April 2026
April 2026
April 2026

 sales@precedenceresearch.com
 +1 804-441-9344
 Download Databook
 Schedule a Meeting