U.S. Fencing Market Size is USD 10.36 Billion in 2026
U.S. Fencing Market (By Material: Metal, Wood, Plastic & Composites, Concrete; By Application: Residential, Agricultural, Industrial) Industry Size, Share, Growth, Trends 2026 to 2035.


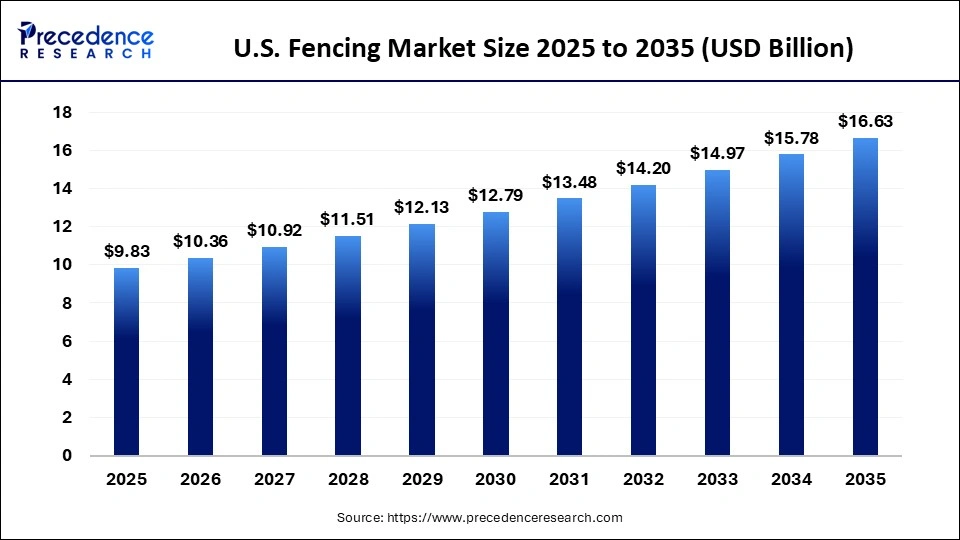
The U.S. fencing market size was estimated at USD 9.83 billion in 2025 and is predicted to increase from USD 10.36 billion in 2026 to approximately USD 16.63 billion by 2035, expanding at a CAGR of 5.4% from 2026 to 2035. Rising safety and security concerns among consumers, along with a surge in residential and commercial construction activities, are boosting the market.
U.S. Fencing Market Statical Scope
| Reports Attributes | Statistics |
| Market Size in 2025 | USD 9.83 Billion |
| Market Size in 2026 | USD 10.36 Billion |
| Market Size by 2035 | USD 16.63 Billion |
| CAGR 2026 to 2035 | 5.4% |
| Base Year | 2025 |
| Forecast Period | 2026 to 2035 |
The fencing market provides a diverse selection of fencing elements and supplies for both residential and commercial applications. This industry offers a range of fencing options, including hardwood, vinyl, chain link, ornamental iron, and farm fencing. Available products comprise fence panels, gates, posts, and hardware, such as hinges and latches, alongside fasteners like nails and screws.
Key market drivers include heightened security concerns, the necessity for property demarcation, and the proliferation of smart fencing systems. Rising crime rates and incidents of intrusion have prompted both commercial and residential users to adopt advanced fencing solutions, including electric and sensor-based fences.
Technological advancements in materials such as composites and vinyl provide low maintenance and high durability, which appeals to consumers. Additionally, the robust real estate market, coupled with governmental investment in infrastructure projects, including highways and parks, is further stimulating demand.
U.S. Fencing Market Share, By Material, 2025 (%)
| Segments | Shares (%) |
| Metal | 56% |
| Concrete | 10% |
| Wood | 18% |
| Plastic and Composites | 16% |
- Metal- Metal fencing holds a 56% share due to its durability, security strength, and broad application across residential, commercial, and infrastructure settings.
- Concrete- Concrete fencing accounts for a 10% share and is gaining favor in response to the demand for high-security, long-lasting, and low-maintenance fencing solutions.
- Wood- Wood fencing represents an 18% share and is primarily favored for its aesthetic appeal in residential applications.
- Plastic and composites- The segment of plastic and composites holds a 16% share due to their increasing adoption for their low maintenance requirements, durability, and sustainable alternatives to traditional wood and metal.
U.S. Fencing Market Share, By Application, 2025 (%)
| Segments | Shares (%) |
| Residential | 64% |
| Agricultural | 20% |
| Industrial | 16% |
- Residential- The residential segment leads with a commanding 64% share, driven by robust consumer demand for privacy, security, and aesthetically pleasing fencing solutions within housing developments and urban expansion projects.
- Agricultural- The agricultural segment holds a 20% share, driven by the growing needs for farm protection, livestock management, and rural infrastructure development.
- Industrial- The industrial segment accounts for 16% share, reflecting demand for specific security and perimeter applications.
Top Companies in the U.S. Fencing Market
- Allied Tube & Conduit
- Ameristar Fence Products Incorporated
- Associated Materials LLC
- Bekaert
- CertainTeed
- Gregory Industries
- Jerith Manufacturing
- Long Fence Company Inc.
- Ply Gem Residential Solutions
- Poly Vinyl Creations
Segments Covered in the Report
By Material
- Metal
- Wood
- Plastic & Composites
- Concrete
By Application
- Residential
- Agricultural
- Industrial
| Material | 2025 | 2026 | 2027 | 2028 | 2029 | 2030 | 2031 | 2032 | 2033 | 2034 | 2035 |
|---|---|---|---|---|---|---|---|---|---|---|---|
| Metal | 4.72 | 4.96 | 5.21 | 5.48 | 5.76 | 6.06 | 6.38 | 6.72 | 7.08 | 7.47 | 7.89 |
| Wood | 2.26 | 2.34 | 2.42 | 2.51 | 2.60 | 2.69 | 2.78 | 2.88 | 2.99 | 3.11 | 3.24 |
| Plastic & Composites | 1.67 | 1.75 | 1.83 | 1.91 | 2.00 | 2.10 | 2.20 | 2.31 | 2.43 | 2.56 | 2.70 |
| Concrete | 1.18 | 1.24 | 1.31 | 1.38 | 1.46 | 1.53 | 1.62 | 1.72 | 1.84 | 1.98 | 2.14 |
| Application | 2025 | 2026 | 2027 | 2028 | 2029 | 2030 | 2031 | 2032 | 2033 | 2034 | 2035 |
|---|---|---|---|---|---|---|---|---|---|---|---|
| Residential | 6.10 | 6.38 | 6.67 | 6.98 | 7.30 | 7.64 | 8.00 | 8.39 | 8.80 | 9.24 | 9.71 |
| Agricultural | 2.16 | 2.26 | 2.37 | 2.48 | 2.60 | 2.72 | 2.85 | 2.99 | 3.13 | 3.28 | 3.45 |
| Industrial | 1.57 | 1.65 | 1.73 | 1.82 | 1.92 | 2.03 | 2.13 | 2.25 | 2.41 | 2.60 | 2.84 |

 sales@precedenceresearch.com
 +1 804-441-9344
 Download Databook
 Schedule a Meeting