U.S. Ingredients Market Size is USD 145.13 Billion in 2026
U.S. Ingredients Market (By End Use: Industrial ingredients, Packaged food and bakery ingredients, Personal care ingredients, Household care ingredients, Others ) Industry Size, Share, Growth, Trends 2026 to 2035.


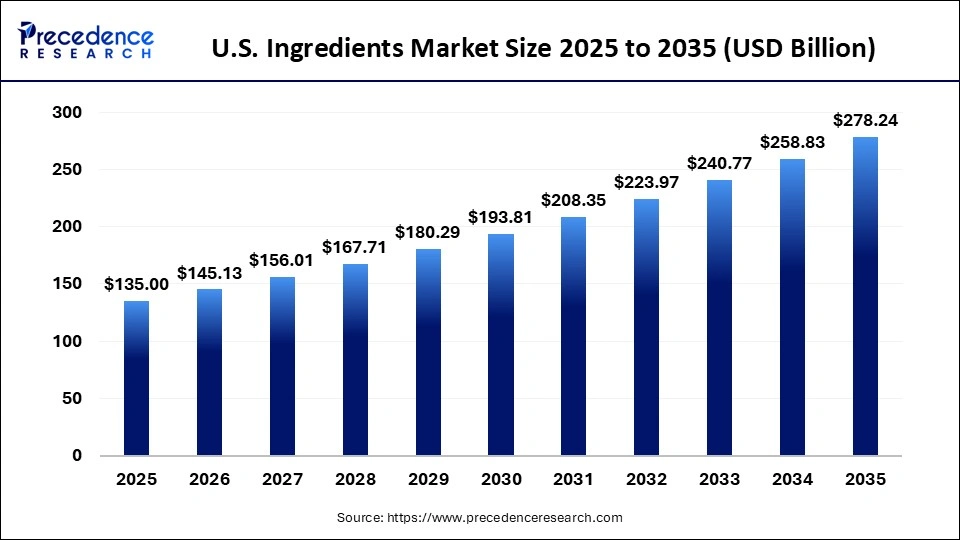
The U.S. ingredients market size was estimated at USD 135 billion in 2025 and is predicted to increase from USD 145.13 billion in 2026 to approximately USD 278.24 billion by 2035, expanding at a CAGR of 7.50% from 2026 to 2035. Rising demand from a wide range of end-use industries is expanding the market.
U.S. Ingredients Market Statical Scope
| Reports Attributes | Statistics |
| Market Size in 2025 | USD 135 Billion |
| Market Size in 2026 | USD 145.13 Billion |
| Market Size by 2035 | USD 278.24 Billion |
| CAGR 2026 to 2035 | 7.5% |
| Base Year | 2025 |
| Forecast Period | 2026 to 2035 |
Ingredients are vital across various industries. In the packed food and bakery sector, they play a crucial role in maintaining and enhancing safety, freshness, taste, appearance, and texture. The demand for specialty ingredients in processed foods, nutraceuticals, and consumer goods that add value to by-products is anticipated to witness substantial growth in the forthcoming years. These ingredients are utilized across multiple industries, including bakery, dairy, beverages, snacks, meat, and infant nutrition.
Key market drivers include the increasing consumer preference for health-conscious, premium, and functional foods, alongside the food industry's shift toward natural, sustainable, and customizable solutions.
In the U.S. personal care sector, the significance of ingredients has markedly increased in recent years across various cosmetic product categories, particularly as they cater to specific consumer needs.
U.S. Ingredients Market Share, By End Use, 2025 (%)
| Segments | Shares (%) |
| Industrial ingredients | 45% |
| Packaged food and bakery ingredients | 25% |
| Personal care ingredients | 15% |
| Household care ingredients | 10% |
| Others | 5% |
-
Industrial ingredients- Industrial ingredients lead the market with a 45% share, primarily driven by large-scale manufacturing across the chemicals, food processing, and other sectors, resulting in the highest volume consumption.
-
Packaged food and bakery ingredients- this segment accounts for 25% of the market share, primarily stimulated by demand from processed and baked food products, although this segment remains below industrial usage due to its narrower application scope.
-
Personal care ingredients- Personal care ingredients represent a 15% share, reflecting steady demand within the cosmetics and skincare markets, as well as an increased consumer preference for natural and organic formulations.
-
Personal care ingredients- Personal care ingredients hold a 10% share, utilized in detergents and cleaning products, with a growing demand for sustainable, plant-based, and multifunctional components.
-
Others- the others segment makes up 5% of the market, encompassing niche and specialized applications with comparatively limited demand relative to the core industrial and consumer segments.
Top Companies in the U.S. Ingredients Market
- BASF
- DuPont
- PPG Industries
- Sherwin-Williams
- Arkema
- Evonik
Segments Covered in the Report
By End Use
- Industrial ingredients
- Packaged food and bakery ingredients
- Personal care ingredients
- Household care ingredients
- Others
| End Use | 2025 | 2026 | 2027 | 2028 | 2029 | 2030 | 2031 | 2032 | 2033 | 2034 | 2035 |
|---|---|---|---|---|---|---|---|---|---|---|---|
| Industrial Ingredients | 40.50 | 43.20 | 45.90 | 49.00 | 52.10 | 55.40 | 59.10 | 63.10 | 67.30 | 71.70 | 76.40 |
| Packaged Food & Bakery Ingredients | 33.75 | 36.50 | 39.10 | 42.00 | 45.30 | 48.80 | 52.60 | 56.80 | 61.10 | 65.80 | 71.00 |
| Personal Care Ingredients | 20.25 | 22.10 | 24.00 | 25.80 | 28.20 | 30.60 | 33.20 | 36.20 | 39.30 | 42.80 | 46.40 |
| Household Care Ingredients | 27.00 | 28.90 | 30.80 | 32.80 | 35.00 | 37.30 | 39.90 | 42.60 | 45.40 | 48.60 | 51.80 |
| Others | 13.50 | 14.50 | 15.50 | 16.60 | 17.80 | 19.10 | 20.60 | 22.10 | 23.70 | 25.40 | 27.30 |
Research Methodology
Related Databooks
March 2026
April 2026
April 2026
April 2026

 sales@precedenceresearch.com
 +1 804-441-9344
 Download Databook
 Schedule a Meeting