U.S. Telehealth Market Size is USD 63.87 Billion in 2026
U.S. Telehealth Market ( By Product: Services, Software, Hardware; By End Use: Web-based, Cloud-based, On-premises; By Disease Area: Providers, Patients, Payers) Industry Size, Share, Growth, Trends 2026 to 2035.


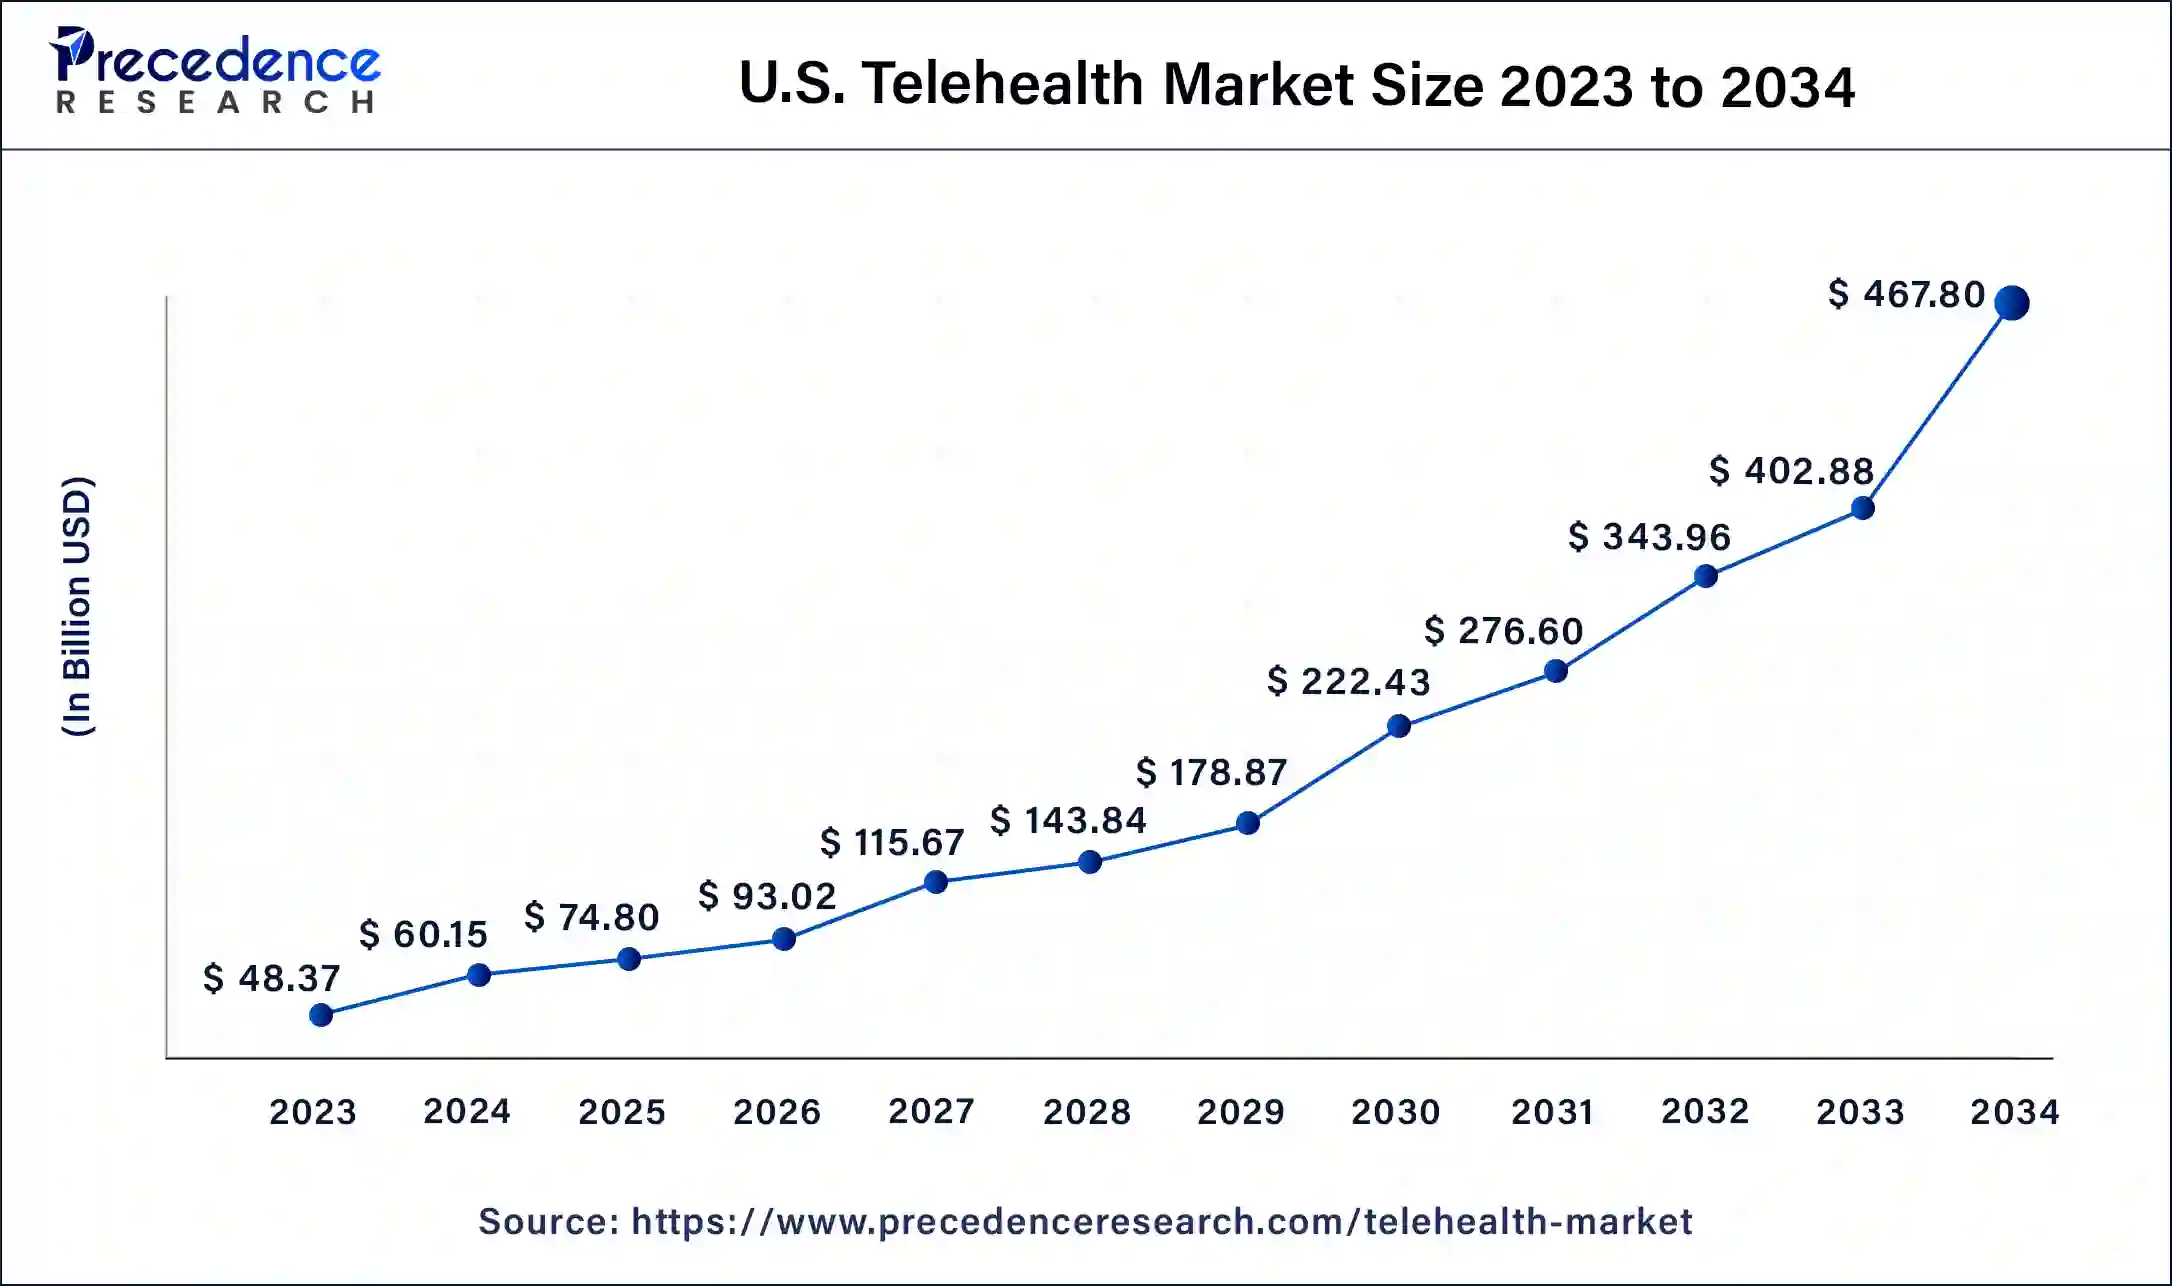
The U.S. telehealth market size was estimated at USD 51.55 billion in 2025 and is predicted to increase from USD 63.87 billion in 2026 to approximately USD 439.48 billion by 2035, expanding at a CAGR of 23.90% from 2026 to 2035. Rising demand for remote healthcare services, along with high internet usage, is driving the market.
U.S. Telehealth Market Statical Scope
| Reports Attributes | Statistics |
| Market Size in 2025 | USD 51.55 Billion |
| Market Size in 2026 | USD 63.87 Billion |
| Market Size by 2035 | USD 439.48 illion |
| CAGR 2026 to 2035 | 23.9% |
| Base Year | 2025 |
| Forecast Period | 2026 to 2035 |
Telehealth refers to the utilization of technology to facilitate remote treatment of patients by healthcare providers, including nurses, consultants, and therapists, thereby enhancing access to care when it is most needed. This approach is instrumental in improving healthcare accessibility, decreasing hospital admissions, reducing costs, and increasing patient convenience.
The telehealth market in the U.S. is undergoing a significant transformation as healthcare providers increasingly adopt hybrid care models that integrate both in-person and virtual services. The rising demand from patients for flexible and on-demand consultations, alongside the proliferation of wearable devices and remote monitoring technologies, is fostering innovation within the sector.
Additionally, heightened investments in cybersecurity, interoperability, and cloud-based platforms are augmenting the capabilities of telehealth. Moreover, insurance companies and employers are actively promoting virtual care solutions to mitigate costs and enhance patient outcomes, thereby accelerating the evolution of healthcare delivery.
U.S. Telehealth Market Share, By Product, 2025 (%)
| Segments | Shares (%) |
| Services | 48% |
| Software | 32% |
| Hardware | 20% |
- Services- The services segment constitutes the largest segment, holding a 48% market share, as they are the foundational element of telehealth delivery, encompassing remote consultations, patient monitoring, and care coordination across healthcare systems.
- Software- Software segment accounts for a 32% share and represents the fastest-growing segment, driven by the increasing adoption of telehealth platforms, AI-enabled tools, and integrated digital health systems that elevate virtual care delivery.
- Hardware- Hardware comprises 20% of the market share, providing essential infrastructure for telehealth, including devices and monitoring tools; however, its growth is restricted by a greater dependence on physical deployment in contrast to scalable digital solutions.
U.S. Telehealth Market Share, By End Use, 2025 (%)
| Segments | Shares (%) |
| Web-based | 46% |
| Cloud-based | 34% |
| On-premises | 20% |
-
Providers- The Providers segment administer 53% of the market, as hospitals, clinics, and physicians primarily drive telehealth adoption to deliver virtual care services.
- Patients- the patients segment constitutes a growing segment with a 30% share, increasingly embracing virtual consultations for their convenience, accessibility, and management of chronic conditions.
-
Payers- The Payers segment accounts for 17% of the market, predominantly utilizing telehealth for cost management and claims optimization rather than direct service delivery.
Top Key Players in the U.S. Telehealth Market
- Koninklijke Philips N.V
- GE Healthcare
- Oracle (Cerner Corporation)
- Siemens Healthineers
- Medtronic
- Teladoc Health Inc.
- American Well
- MDLIVE
- Doctor On Demand
- GlobalMed
Segments Covered in the Report
By Product
- Services
- Software
- Hardware
By End Use
- Web-based
- Cloud-based
- On-premises
By Disease Area
- Providers
- Patients
- Payers
| Product | 2025 | 2026 | 2027 | 2028 | 2029 | 2030 | 2031 | 2032 | 2033 | 2034 | 2035 |
|---|---|---|---|---|---|---|---|---|---|---|---|
| Services | 23.20 | 28.74 | 35.61 | 44.12 | 54.67 | 67.73 | 83.92 | 103.98 | 128.83 | 159.62 | 197.77 |
| Software | 18.04 | 22.35 | 27.70 | 34.32 | 42.52 | 52.68 | 65.27 | 80.87 | 100.20 | 124.15 | 153.82 |
| Hardware | 10.31 | 12.77 | 15.83 | 19.61 | 24.30 | 30.10 | 37.30 | 46.21 | 57.26 | 70.94 | 87.90 |
| End Use | 2025 | 2026 | 2027 | 2028 | 2029 | 2030 | 2031 | 2032 | 2033 | 2034 | 2035 |
|---|---|---|---|---|---|---|---|---|---|---|---|
| Web-based | 20.62 | 25.55 | 31.65 | 39.22 | 48.59 | 60.21 | 74.60 | 92.42 | 114.51 | 141.88 | 175.79 |
| Cloud-based | 23.20 | 28.74 | 35.61 | 44.12 | 54.67 | 67.73 | 83.92 | 103.98 | 128.83 | 159.62 | 197.77 |
| On-premises | 7.73 | 9.58 | 11.87 | 14.71 | 18.22 | 22.58 | 27.97 | 34.66 | 42.94 | 53.21 | 65.92 |
Research Methodology
Related Databooks
March 2026
March 2026
March 2026
March 2026

 sales@precedenceresearch.com
 +1 804-441-9344
 Download Databook
 Schedule a Meeting