


Fertilizer Market Size, Key Companies, Company Market Share, Crop Production Volume, Yield Analysis, Export & Import Trends, Pricing Metrics, Competitive Positioning, and Demand Forecast
The global fertilizer market is expanding steadily as rising food demand, shrinking arable land per capita, and the adoption of precision agriculture and nutrient-efficient formats increase the need for crop nutrients. Asia-Pacific leads the market, while the Middle East and Africa are expected to grow fastest, supported by natural gas feedstock and food-security-driven capacity investment. The report analyzes the market by form, application, product and region, covering trade flows, regional dynamics, industry consolidation, competitive positioning, leading companies, strategic developments, value chain and long-term growth outlook, helping producers, distributors, suppliers and investors identify where future growth and opportunities will be concentrated.
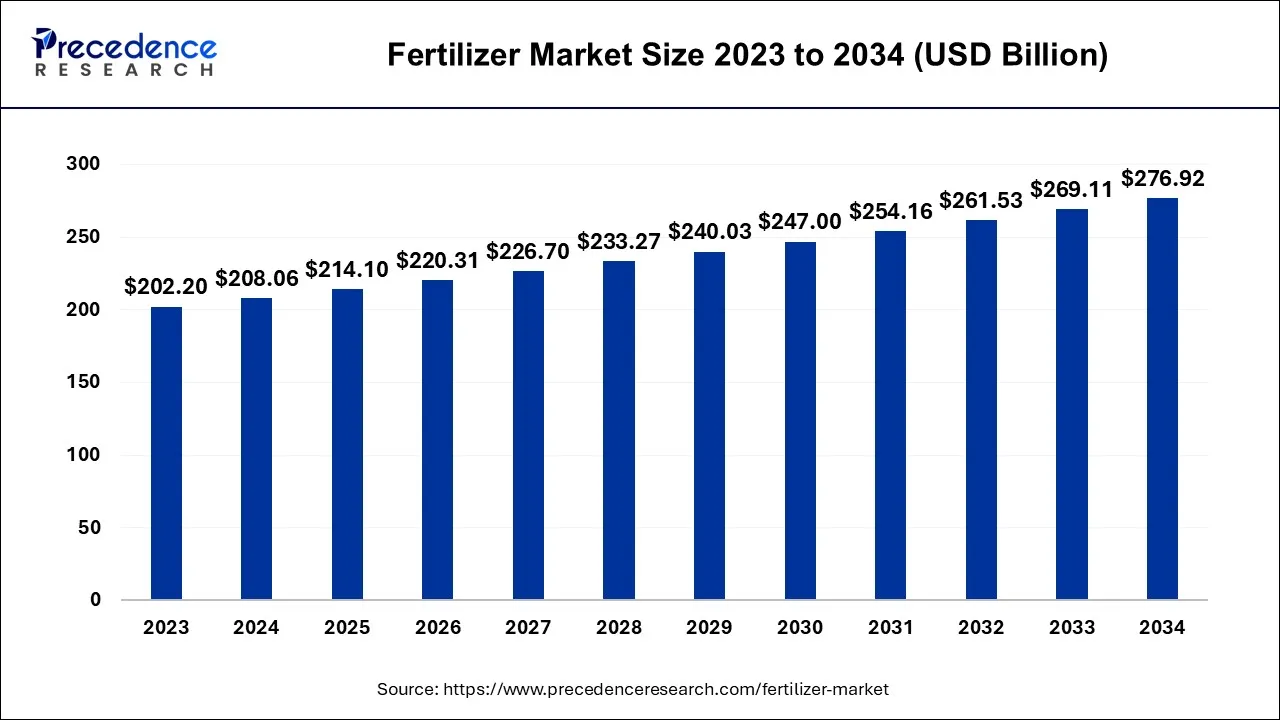
Source: https://www.precedenceresearch.com/fertilizer-market
 Get a Sample
 Table Of Content


What is the Fertilizer Market Size?
The global fertilizer market size is predicted to increase from USD 220.31 billion in 2026 to approximately USD 284.58 billion by 2035, expanding at a CAGR of 2.89% over the forecast period from 2026 to 2035. The Asia-Pacific market led the global market with the highest market share of 50% in 2026, reflecting the region's scale of cereal and rice cultivation and strong government-backed agricultural programs. The Middle East and Africa region is expected to grow at a notable CAGR in the foreseeable period, supported by abundant natural gas feedstock for ammonia synthesis and food-security-driven capacity investment. Growth is being driven primarily by rising global food demand, shrinking arable land per capita, and accelerating adoption of precision agriculture and nutrient-efficient product formats.
Key Takeaways
- Asia-Pacific led the market with a 50% share in 2026, reflecting its scale of cereal and rice cultivation and government-backed agricultural programs.
- The Middle East and Africa are expected to post the fastest regional growth, supported by natural gas feedstock for ammonia and food-security-driven capacity investment.
- Dry fertilizers held the largest share by form in 2026, while liquid fertilizers are the fastest-growing form.
- Agriculture held the largest share by application in 2026, while horticulture is the fastest-growing application.
- Organic products held the largest share by product type in 2026, while inorganic products are the fastest-growing type.
- Global fertilizer trade recorded 725 shipments between June 2026 and May 2026, a 2% year-over-year increase, involving 96 verified exporters and 174 buyers.
- The U.S. completed 19,976 shipments, China 19,325 and Spain 17,153, placing them among the most active fertilizer-exporting nations.
- The industry is moderately consolidated, with large multinational producers operating alongside regional and local players and moderate entry barriers.
- Nutrien, Yara International, CF Industries, and Haifa Group are among the companies with the most significant market presence.
- In March 2026, ICL launched a specialty fertilizer production facility in Maharashtra, India, and IFFCO introduced indigenously developed Nano NPK fertilizers.
- Value chain control sits in three layers: integrated producers through scale and nutrient access, cooperative networks through last-mile reach, and export-oriented producers through trade access and compliance.
- The segments generating the most incremental growth (liquid, horticulture, inorganic) differ from the largest segments today (dry, agriculture, organic).
Market Size & Forecast A Steady Single-Digit Growth Trajectory Through 2035
The global fertilizer market is on a steady, moderate growth path, expanding from its base year through the forecast period as food demand rises, and farming becomes more precise. Growth is gradual rather than rapid, reflecting the market's mature, bulk-commodity base. Asia-Pacific is the main engine of this expansion, growing modestly faster than the global average and contributing to most of the incremental demand.
Key Coverage
- Global and regional market sizing, 2026 to 2036
- Regional CAGR comparison
- Base-year and forecast-year value benchmarks
Segmentation Analysis Dry, Agricultural and Organic Formats Dominate Volume, While Liquid, Horticultural and Inorganic Formats Lead Growth
The market is segmented across three core product dimensions: form, application, and product type, plus geography.
By Form: Dry vs. Liquid
The dry fertilizer segment has garnered its largest market share in 2026, making it the dominant delivery format globally. Dry (granulated or powdered) fertilizers dominate large-acreage field-crop use, including grains, cereals, and oilseeds, because they are generally less expensive to produce, transport, and store than liquid formats; they can be stored for extended periods without specialized infrastructure; they are compatible with standard application equipment (spreaders, seeders, planters); and they release nutrients more slowly, carrying a lower risk of plant "burning" than liquid formats. The liquid fertilizer segment is expected to witness the fastest growth in the market with a CAGR over the forecast period, propelled by rising demand for high-efficiency nutrient delivery, ease of administration, and the broader shift toward precision and irrigated agriculture, where fertigation allows tightly controlled, metered nutrient application.
By Application Agriculture, Horticulture, and Gardening
The agriculture segment accounted for the largest market share in 2026, anchored by field-crop cultivation across grains and cereals, oilseeds, fruits and vegetables, and other categories, where fertilizers supply nitrogen, phosphorus, and potassium alongside select micronutrients like zinc. The horticulture segment is expected to gain the highest market share with a CAGR between 2026 and 2035, reflecting rising global demand for fruits, vegetables, flowers, and ornamental plants, crops with more specific and often more intensive nutrient requirements per hectare than broadacre field crops. Gardening remains in the smallest application category, serving residential and landscaping demand through retail rather than agricultural-supply channels.
By Product Organic vs. Inorganic
The organic segment accounted for an abundant market share in 2026. In this segmentation, "organic" refers broadly to naturally sourced mineral and biological nutrient inputs, split into plant-based, animal-based, and mineral-based fertilizers, valued for slow, balanced nutrient release and their role in restoring soil fertility depleted by heavy synthetic input use. The inorganic segment is expected to show the fastest growth with a CAGR over the forecast period, driven by large-scale commercial agriculture's need for concentrated, fast-acting, high-yield-supporting nutrient formulations, plus practical advantages in shelf life, storage, and transport. Inorganic fertilizers are further segmented by nutrient: nitrogen (urea, anhydrous ammonia, ammonium nitrate, UAN solutions, ammonium sulfate), phosphorus (DAP, MAP, TSP, ordinary superphosphate, ammonium polyphosphate, and others), and potassium (potassium chloride, potassium sulfate, potassium nitrate).
By Geography
The market spans North America (U.S., Canada), Europe (U.K., Germany, France), Asia-Pacific (China, India, Japan, South Korea, Malaysia, Philippines), Latin America (Brazil, Rest of Latin America), and Middle East & Africa (GCC, North Africa, South Africa, Rest of MEA), with Asia-Pacific holding the largest regional share at 50% in 2026.
Across all three product dimensions, the pattern is consistent: the largest segments (dry, agriculture, organic) reflect the market's bulk-commodity, broadacre-farming base, while the fastest-growing segments (liquid, horticulture, inorganic) point toward the same underlying shift: increasingly precise, higher-intensity, higher-value nutrient delivery as farming systems modernize.
Key Coverage
- Share and growth-rate breakdown by form, application, and product type
- Sub-segment detail (nitrogen, phosphorus, potassium product types; organic sub-categories)
- Largest vs. fastest-growing segment identification across all dimensions
- Geographic segmentation by country/sub-region
Which Trade Corridors Carry the Greatest Exposure to Global Fertilizer Supply Disruption?
Global fertilizer trade activity remained on a modest growth path between June 2026 and May 2025, with 725 shipments recorded over the period, a 2% year-over-year increase. This trade involved 96 verified exporters and 174 buyers, a relatively narrow base of participants relative to the scale of global fertilizer consumption. At the country level, the U.S. completed 19,976 shipments, China achieved 19,325 shipments, and Spain achieved 17,153 shipments, placing all three among the most active fertilizer-exporting nations globally.
Our analysis indicates that global fertilizer trade is structurally concentrated rather than broadly distributed. A market of this scale being served by fewer than 100 verified exporters and under 200 active buyers suggests that trade-flow continuity rests on a comparatively small set of relationships, rather than a deep, diversified supplier base. We believe this concentration is a direct consequence of the industry's underlying production economics: nitrogen, phosphate, and potash output is inherently tied to feedstock and mineral-reserve geography, which naturally limits the number of countries capable of exporting at meaningful scale, regardless of how many countries need to import.
In our view, the most significant implication is asymmetric risk exposure for import-dependent agricultural economies. When trade flows run through a narrow band of exporters, any disruption at the country or company level, whether from export licensing changes, feedstock shortages, logistics bottlenecks, or geopolitical restriction, has an outsized ability to propagate into global pricing and availability. We expect buyers in structurally import-reliant regions to continue prioritizing supplier diversification and longer-term offtake arrangements as a hedge against this concentration risk, and we see this as a persistent, structural feature of the market rather than a temporary post-disruption artifact.
The full report extends this analysis with shipment-level trade flow mapping by exporting and importing country, corridor-level volume and frequency trends, buyer concentration analysis, and a comparative view of how trade intensity for the top exporting nations has evolved year over year.
This trade intelligence also lends itself naturally to a structured, queryable dataset: shipment records by exporter, buyer, origin and destination country, product category, and month, allowing clients to benchmark individual trade corridors, track shifts in exporter or buyer concentration over time, and flag emerging dependency risk at the country or company level. This dataset is designed to complement the strategic narrative above by giving procurement and supply-chain teams a granular, filterable view of exposure that the report-level analysis can only summarize.
Which Regions Offer the Strongest Combination of Scale, Growth and Strategic Access for Fertilizer Producers?
Regional dynamics in the fertilizer market are diverging along distinct structural lines rather than converging toward a single global growth pattern. China's market continues to expand on the back of government-backed agricultural modernization, self-sufficiency goals, and growing adoption of eco-friendly and digitally integrated farming technologies, reinforcing Asia-Pacific's position as the market's scale anchor. North America's growth is characterized by advanced farming systems, mechanization, and strong precision-agriculture adoption, with the U.S. specifically driven by large arable land bases and rising demand for organic and precision nutrient solutions. Europe's trajectory is being shaped primarily by stringent environmental regulation and innovation in specialty and sustainable formats, while the Middle East and Africa's growth centers on Saudi Arabia's petrochemical base and large-scale ammonia production capacity, backed by continued investment in export-oriented and green-ammonia projects. In Latin America, Brazil holds the largest regional share, underpinned by continued expansion of soybean, corn, and sugarcane export acreage.
Our analysis indicates that each region's growth is being driven by a fundamentally different lever, government policy and modernization in China, technology adoption in North America, regulatory compliance in Europe, feedstock advantage in the Middle East, and export-crop acreage expansion in Brazil. This is not a market where a single global playbook applies; a producer's competitiveness depends heavily on which regional lever it is best positioned to exploit. We believe this divergence also signals that regional growth is more structurally durable than cyclical. Each driver, including subsidy programs, arable land availability, regulatory regimes, natural gas reserves, and export-crop economics, reflects a long-term national or regional asset rather than a short-term demand fluctuation.
In our view, the most significant implication is that the geographic strategy needs to be differentiated by capability rather than replicating uniformly across markets. Producers with strong digital agronomy and precision-application technology are best positioned to capture share in North America and increasingly in China; producers with low-carbon and specialty-formulation capability are best positioned for Europe; and producers with integrated ammonia and gas-feedstock access are best positioned to capture the Middle East and Africa's export-oriented growth. From our assessment, this creates a clear opportunity for feedstock-advantaged producers in the Middle East to expand export share into Africa and South Asia, where demand growth is strong, but domestic production capacity remains comparatively underdeveloped.
The full report extends this regional view with country-level market sizing and CAGR, regional and country-level segment mix (form, application, product type), regulatory and policy comparison across major markets, and a mapping of which producer capabilities align with regional growth drivers.
This regional intelligence also translates naturally into a structured, filterable dataset: market size, CAGR, segment share, and key growth driver tracked by country and year, allowing clients to benchmark regional attractiveness side by side, monitor how each market's growth composition shifts over time, and screen for expansion or entry opportunities that match their specific capability profile. This dataset is intended to give strategy and market-entry teams a granular, comparable base to work from, beyond the narrative-level regional view above.
What Does the Fertilizer Industry's Moderate Consolidation Mean for Competitive Strategy?
The fertilizer industry is moderately consolidated, with large multinational producers operating alongside regional and local players. Competitive positioning across this landscape is shaped by five factors: production scale, pricing, distribution reach, feedstock access, and progress on low-carbon and specialty product innovation. Entry barriers are moderate rather than high, given the combination of capital intensity, feedstock dependency, and environmental compliance requirements, even though the structure remains open enough for new entrants to establish a position.
Our analysis indicates that "moderate consolidation" is a more strategically meaningful description than a fragmented oligopolistic market, because it implies that scale alone does not guarantee competitive protection. If entry barriers were high, incumbents could rely primarily on capacity and feedstock access to defend share; if the market were fragmented, competition would be driven mainly on price. Instead, the coexistence of global majors with regional and local players suggests that multiple, distinct competitive strategies (scale-based cost leadership, feedstock-advantaged production, and specialty/local-market differentiation) can each succeed simultaneously without one structurally dominating the others.
In our view, the most significant implication is that competitive advantage in this market is increasingly multidimensional rather than single-lever. A producer competing purely on scale and price is exposed to feedstock-advantaged rivals with structurally lower cost positions, while a producer without meaningful low-carbon or specialty capability risks losing ground as environmental compliance requirements get stricter and buyers prefer sustainability credentials. We believe this creates a bifurcating competitive environment: producers are likely to sort increasingly into either cost/scale leaders or differentiated specialty and regional players, with mid-positioned competitors facing the greatest strategic pressure.
Which Companies Lead the Market and What Does Each Specialize In?
The competitive set spans integrated crop-input suppliers, nitrogen and phosphate producers, specialty nutrient players and distribution cooperatives. Each competes in a different value pool, so company size alone does not show market position. The table below groups the leading participants by headquarters, role and core strength.
| Company | Headquarters | Market Position | Core Strength | Major Applications/Segments |
| Nutrien Ltd. | Canada | Integrated crop-input leader | Potash, nitrogen and phosphate inputs with retail and digital agriculture solutions | Potash, nitrogen, phosphate, agri retail |
| Yara International ASA | Norway | Nitrogen fertilizer leader | Low-carbon crop nutrition, including calcium nitrate | Nitrogen fertilizers, crop nutrition |
| CF Industries Holdings Inc. | United States | Nitrogen producer | Ammonia, urea, UAN and ammonium nitrate with a low-carbon manufacturing focus | Ammonia, urea, UAN, ammonium nitrate |
| Haifa Group | Israel | Specialty nutrient player | Water-soluble nutrients and controlled-release biostimulants | Specialty and water-soluble fertilizers |
| Syngenta AG | Switzerland | Major participant | Crop protection and seeds* | Crop inputs |
| Bunge Limited | United States | Major participant | Agribusiness and food supply chain* | Agribusiness, crop inputs |
| Israel Chemicals Ltd. (ICL) | Israel | Major participant | Potash, phosphate and specialty minerals* | Specialty plant nutrition |
| Indian Farmers Fertilizer Cooperative Limited (IFFCO) | India | Major participant | Cooperative fertilizer manufacturing and distribution* | Urea, complex fertilizers |
| Sumitomo Chemical Co. Ltd | Japan | Major participant | Diversified chemicals with an agro business* | Agrochemicals, crop nutrition |
| Gemlik Fertilizer Inc. | Turkey | Major participant | Regional fertilizer production* | Fertilizers |
| OCP Group | Morocco | Phosphate leader | Phosphate production, with export and trade-compliance roles | Phosphate fertilizers |
| PhosAgro | Russia | Phosphate producer | Phosphate production, with export and trade-compliance roles | Phosphate fertilizers |
| National Fertilizers Limited | India | Distribution-focused cooperative | Fertilizer production and distribution | Urea, domestic distribution |
| KRIBHCO | India | Distribution-focused cooperative | Cooperative fertilizer production and distribution | Urea, domestic distribution |
Are Recent Strategic Developments Signalling a Structural Shift in India?
Four developments between September 2025 and March 2026 point in the same direction. In March 2026, ICL launched a new specialty fertilizer production facility in Maharashtra to strengthen domestic manufacturing amid global supply disruption. That same month, IFFCO introduced indigenously developed Nano NPK fertilizers in liquid (8-8-10) and granular (20-10-10) formulations following approval under the Fertiliser Control Order. Earlier, in October 2025, an agriculture department partnered with regional sugar mills to convert sugarcane trash into organic fertilizer, and in September 2025 a renewables infrastructure company expanded into fertilizer manufacturing and trading.
Our analysis indicates that these moves are not isolated announcements but reflect three converging priorities: supply security, product differentiation and input circularity. Domestic capacity and regulatory-approved formulations show capability being built inside India rather than imported. The dual-format NPK launch suggests innovation is moving beyond single-nutrient nano products toward multi-nutrient, application-specific offerings, while waste-to-nutrient models and cross-sector entry show growing institutional and capital interest. Capacities, investment values and pricing are not yet disclosed, so the scale of these initiatives remains an open question.
In our view, competitive advantage is estimated to shift from volume and subsidy-linked throughput toward formulation capability, regulatory readiness and localized supply. Regulatory approval of novel formulations is becoming a meaningful entry barrier, and circular inputs create regional opportunities near feedstock-rich sugar belts. From our assessment, this favors specialty and nano-fertilizer players, bio-input producers and cross-sector entrants, and challenges import-dependent suppliers. We expect this pattern to continue, though its pace will depend on farmer adoption, distribution reach and policy support.
The full report quantifies the impact on capacity additions, product mix and regional supply balance, assesses the rationale behind each move, and benchmarks announced launches and partnerships against expected demand to show where competitive intensity is rising and where white space remains.
The same intelligence is available as a structured dataset tracking developments by date, company, development type, product category, nutrient formulation, location, regulatory status and strategic objective. Filtering by region, product type or player category lets clients benchmark activity, identify emerging entrants and monitor the pace of localization over time.
Where Does Strategic Leverage Lies Between Production, Distribution and Trade?
Processing and packaging, which converts raw nutrient inputs into branded, market-ready product, is led by integrated producers such as Nutrien, Yara International, The Mosaic Company, CF Industries Holdings and Coromandel International. Distribution to wholesalers and retailers is concentrated among cooperative and national networks such as IFFCO and KRIBHCO. Export and trade-compliance functions, covering licensing, documentation and cross-border quality standards, are associated with OCP Group, Yara International and PhosAgro, reflecting the concentration of export-oriented nitrogen and phosphate capacity among a small number of globally active producers.
Our analysis indicates that control is structured into three distinct layers: integrated producers hold leverage through scale and nutrient access, cooperative networks through last-mile reach to farmers, and export-oriented producers through trade access and compliance capability. Yara International's presence in both processing and export roles shows that the strongest positions are held by players spanning more than one stage. Stage-wise margins, volumes and shares are not available in the source material, so the profit pool at each layer cannot be quantified here.
In our view, bargaining power lies at the two ends of the chain, with global producers controlling supply and export access and national networks controlling market reach. Smaller regional processors dependent on both are likely to face the greatest margin and supply-security pressure, while importers exposed to a narrow set of export suppliers carry concentration risk. From our assessment, opportunity lies with players that can secure differentiated formulations or distribution partnerships. We expect this concentration to persist, as trade compliance and distribution reach are difficult to replicate quickly.
The full report quantifies stage-wise value addition, margin structure and market concentration, and assesses vertical integration strategies, trade-flow dependencies and regional supply-risk exposure to show where to partner, integrate or compete.
A structured dataset is also available, mapping players by value-chain stage, role, nutrient category, geography, capacity, export orientation and distribution reach, with filters to benchmark positioning, identify integration gaps and track shifts in supply-chain control over time.
Where Will the Next Decade of Fertilizer Market Growth Actually Be Concentrated?
The fertilizer market's headline growth rate masks meaningfully different trajectories beneath it. Asia-Pacific is expected to continue leading in absolute value contribution, while the Middle East and Africa are projected to post the fastest regional growth rate. At the same time, the liquid, horticulture-oriented, and inorganic product segments are expected to outgrow their respective category averages, even though dry, agriculture-focused, and organic products will retain the largest share of overall volume and value through the forecast period.
Our analysis indicates that this is a market undergoing compositional change well ahead of any change in its overall size. The headline CAGR is a modest, steady growth rate at the aggregate level, but the fact that specific segments (liquid, horticulture, inorganic) and a specific region (Middle East and Africa) are each growing faster than that average signals that the mix of the market in 2036 will look structurally different from the mix today, even if total market value growth appears unremarkable on the surface. We believe this divergence between "where the volume sits" and "where the growth sits" is the central strategic fact of this market's next decade: the largest segments today (dry, agriculture, organic) are not the same as the segments generating the most incremental opportunity going forward.
In our view, the most significant implication is that a strategy built solely around defending current volume leadership in dry, agriculture-focused, and organic products would capture a shrinking share of the market's forward growth, even while remaining the largest category by absolute size.
From our assessment, this creates a clear opportunity for producers with liquid-formulation, horticulture-specific, and inorganic/synthetic manufacturing capability to capture disproportionate share of incremental value through 2036, particularly if that capability is paired with a presence in the Middle East and Africa, where regional growth and specialty-format demand are likely to reinforce one another. We expect this bifurcation to widen over the forecast period rather than converge, as precision-agriculture adoption and specialty-crop cultivation continue to expand from a comparatively low base.
The full report extends this outlook with year-by-year value and volume forecasts through 2036, segment-level and regional CAGR comparisons, base/upside/downside scenario modeling, and an assessment of which combinations of segment and regional exposure are best positioned to outperform the market average over the forecast period.
Key Strategic Questions Addressed
- How large is the global fertilizer market in 2026, and how fast is it expected to grow through 2035?
- Which forms, applications, and product types are driving the largest volumes and the fastest growth?
- Which trade corridors and exporter relationships carry the greatest exposure to supply disruption?
- Which regions offer the strongest combination of scale, growth, and strategic access?
- How does moderate industry consolidation shape competitive strategy and entry barriers?
- Which companies are best positioned, and what strategic developments and value chain dynamics are reshaping the competitive landscape?
- Where will the next decade of growth be concentrated, and how will precision agriculture and low-carbon technologies reshape demand through 2035?
Fertilizer Market Segments
By Form
- Dry
- Liquid
By Application
- Agriculture
- Horticulture
- Gardening
By Product
- Organic - Plant-Based
- Organic - Animal-Based
- Organic -Mineral-Based
- Inorganic -Nitrogen
- Inorganic -Phosphorus
- Inorganic -Potassium
By Inorganic Nutrient Type
- Urea
- Anhydrous Ammonia
- Ammonium Nitrate
- UAN Solutions
- Ammonium Sulfate
- DAP
- MAP
- TSP
- Ordinary Superphosphate
- Ammonium Polyphosphate
- Potassium Chloride
- Potassium Sulfate
- Potassium Nitrate
By Region
- North America
- Europe
- Asia-Pacific
- Latin America
- Middle East & Africa
By Country
- U.S.
- Canada
- U.K.
- Germany
- France
- China
- India
- Japan
- South Korea
- Malaysia
- Philippines
- Brazil
- Rest of Latin America
- GCC
- North Africa
- South Africa
- Rest of MEA
For inquiries regarding discounts, bulk purchases, or customization requests, please contact us at sales@precedenceresearch.com
Frequently Asked Questions
Tags





Ask For Sample
No cookie-cutter, only authentic analysis – take the 1st step to become a Precedence Research client
 Get a Sample




 sales@precedenceresearch.com
 Schedule a Meeting