Waste Management Market Size, Key Companies, Company Technology / Innovation, Production Economics, Trade Analysis, Material Efficiency, Market Penetration, Company Investment Strategies, and Sustainability Trends
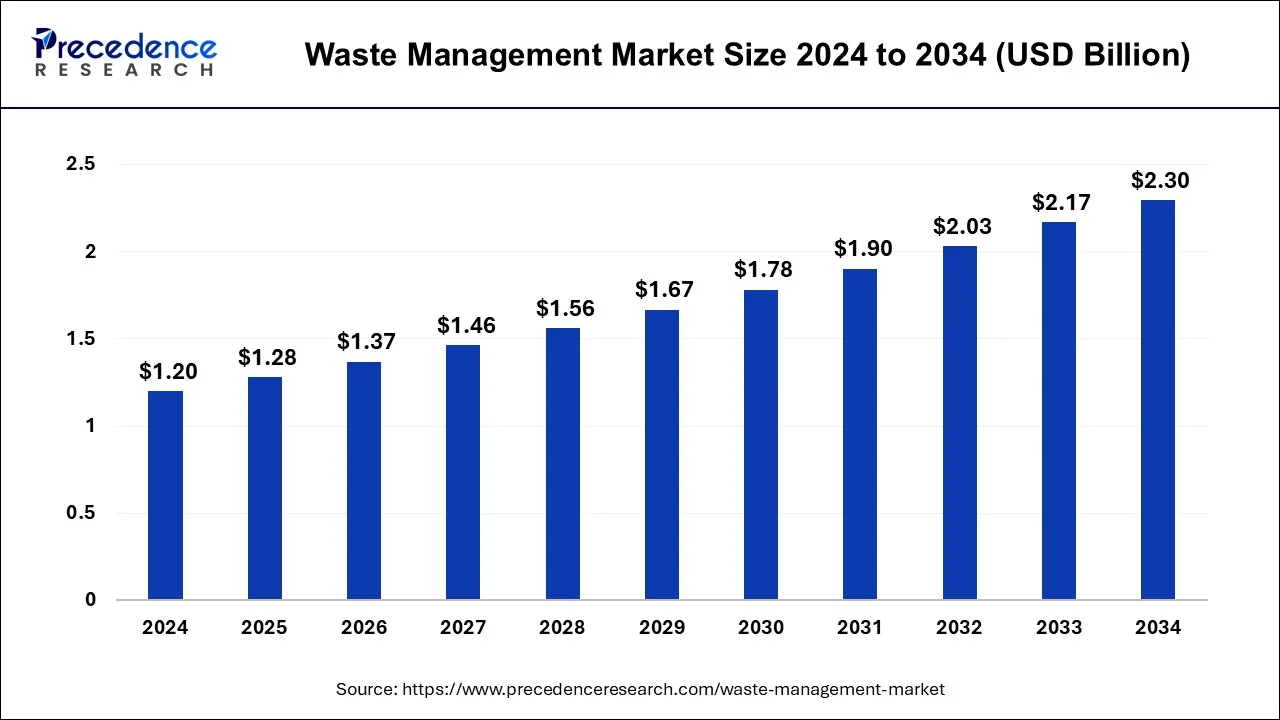
The global waste management market was valued at USD 1.37 trillion in 2026 and is projected to reach USD 2.44 trillion by 2035, driven by rising focus on recycling, circular economy initiatives, and sustainable waste disposal practices. North America dominates the market, while Asia Pacific is the fastest-growing region due to rapid urbanization and increasing environmental regulations.
Source: https://www.precedenceresearch.com/waste-management-market
 Get a Sample
 Table Of Content


What is the Waste Management Market Size?
The global waste management market size is accounted at USD 1.28 trillion in 2025 and predicted to increase from USD 1.37 trillion in 2026 to approximately USD 2.44 trillion by 2035, growing at a CAGR of 6.66% from 2026 to 2035. Waste Management Market growth is driven by rising urbanization, increasing waste generation, expanding recycling infrastructure, and growing investments in sustainable waste treatment technologies.
Waste Management Market Key Takeaways
- It is projected to reach USD $2.44 trillion by 2035.
- Asia Pacific region accounted for 59.14% market share in 2026.
- The Middle East and Africa are expected to grow at a CAGR of 6.4% from 2026 to 2035.
- By waste type, municipal waste accounted for 32.3% market share of the global market in 2025.
- By waste type, the e-waste segment is growing at a registered CAGR of 7.3% from 2026 to 2035.
- By service type, the collection segment has garnered a market share of around 63% in 2025.
- By service type, the disposal service segment is poised to reach a CAGR of 7.1% between 2026 to 2035.
Overview - Waste Management is Shifting From Disposal-Centric Services Toward Integrated Resource Recovery
The global Waste Management Market is estimated at approximately USD 1.37 trillion in 2026, with the industry expanding at approximately 6.66% CAGR toward 2026-2035. Global municipal solid waste generation already exceeds 2 billion tonnes annually and is projected to approach 3.4 billion tonnes by 2050, creating sustained demand for collection, transportation, treatment, recycling and disposal infrastructure.
The market is becoming increasingly differentiated by waste stream and treatment economics. Mature markets are characterized by high collection coverage, regulated disposal infrastructure and growing recycling intensity, while emerging markets offer significant opportunities to formalize collection and treatment systems. Asia Pacific represents the largest volume-growth opportunity, while North America and Europe benefit from higher service penetration, disposal infrastructure and regulatory-driven treatment spending.
The full report quantifies the market by waste type, service, treatment method, application, customer, geography and competitive position, while separating volume-driven growth from pricing, mix, infrastructure investment and regulatory effects.
Key Coverage
- 2025 market size and historical growth
- 2030 and 2035 forecasts
- Waste volume and revenue growth
- Regional market contribution
- Largest and fastest-growing waste streams
- Collection, recycling, treatment and disposal economics
- Market concentration and maturity
Market Size - Increasing Waste Volumes and Higher Treatment Intensity Are Expanding the Addressable Revenue Pool
The global Waste Management Market is estimated at approximately USD 1.37 trillion in 2026 and is projected to reach approximately USD 1.78 trillion by 2030, representing a CAGR of 6.66%. The market could reach approximately USD 2.44 trillion by 2035, depending on the pace of urbanization, infrastructure development, recycling adoption, regulatory implementation and resource-recovery investment.
Revenue growth is expected to exceed the growth of municipal waste volumes in several mature markets because each tonne increasingly generates value across multiple activities: collection, sorting, recycling, treatment, energy recovery and final disposal. This creates opportunities for operators to increase revenue per managed tonne without relying exclusively on volume growth.
The full analysis provides historical market values, base-year estimates, forecast scenarios, regional contribution, segment-level revenue, waste volumes, revenue per tonne and incremental opportunity through 2035.
Key Coverage
- Historical market size
- 2025 base-year value
- 2030/2035 forecasts
- CAGR
- Incremental revenue opportunity
- Waste-management volume
- Regional forecasts
- Segment forecasts
- Base/upside/downside scenarios
Segmentation Analysis
Collection Remains the Largest Revenue Pool While Specialized Recovery Streams Expand Faster
Collection and transportation represent the foundation of the market, while landfill, recycling, waste-to-energy, composting, anaerobic digestion and specialized treatment create distinct value pools. Municipal solid waste remains strategically important because of its recurring generation, while industrial, hazardous, healthcare, construction and demolition, electronic and organic waste create higher-value specialized opportunities.
Global e-waste generation reached approximately 62 million tonnes in 2022 and is projected to approach 82 million tonnes by 2030, highlighting the rapidly expanding opportunity in specialized collection and material recovery.
The report evaluates waste management by waste type, service, treatment technology, application, customer, business model and geography, identifying the largest, fastest-growing, highest-value and emerging segments.
Key Coverage
- Municipal solid waste
- Commercial and industrial waste
- Hazardous waste
- Construction and demolition waste
- E-waste
- Organic waste
- Healthcare waste
- Collection and transportation
- Recycling and material recovery
- Landfill and disposal
- Waste-to-energy
- Composting and anaerobic digestion
Which Structural Forces Are Increasing Waste Volumes While Raising the Value of Managed Waste?
Global municipal solid waste is measured in billions of tonnes annually and is projected to rise materially through 2050, driven by urbanization, population growth, industrialization and rising consumption. At the same time, landfill restrictions, extended producer responsibility (EPR), recycling mandates and tighter environmental standards are increasing the share of waste that needs formal collection, sorting, treatment and recovery. Industry economics are shifting from simple disposal toward recycling, organics treatment, waste-to-energy and specialized processing.
Our analysis indicates that regulation is becoming an economic growth driver rather than only a compliance cost. Higher diversion targets raise revenue per managed tonne by adding sorting, treatment and recovery steps, while landfill scarcity raises disposal costs and strengthens the value of permitted capacity. However, infrastructure shortages, labor and fuel costs, permitting delays, municipal budget constraints and recovered-material price volatility can slow the conversion of volume growth into revenue.
In our view, the key implication is a widening gap between waste volume growth and compliant treatment capacity. Operators with dense collection networks, permitted infrastructure and diversified revenue should capture rising value per tonne, while markets reliant on informal collection may commercialize slowly despite strong volume growth. The full report evaluates waste-generation trends, urbanization, recycling mandates, EPR, landfill restrictions, municipal spending, fuel and labor economics, commodity exposure and infrastructure gaps.
How Are Disposal Scarcity, Treatment Complexity and Contract Structures Shaping Revenue per Managed Tonne?
Pricing varies by waste stream, service type and local infrastructure, and is commonly measured in $/tonne, $/pickup, container fees, tipping fees and treatment charges. Collection pricing follows route density, labor and fuel costs, while landfill and treatment pricing reflects permitted capacity, transport distance, contamination and regulation. Hazardous, healthcare and certain industrial streams command higher prices because of stricter handling and liability requirements.
Our analysis indicates that revenue per managed tonne is increasingly differentiated by treatment intensity rather than volume. Landfill scarcity supports higher tipping fees, and specialized services earn premiums where compliance and processing demands are high. Recovered-material prices add volatility, so higher service prices do not automatically mean stronger margins. Escalation clauses for inflation and fuel partly protect operators, but contract structure and competitive bidding still determine realized pricing.
In our view, operators with scarce disposal capacity, specialized treatment and diversified portfolios can earn higher revenue per tonne and reduce commodity exposure, while standardized collection stays sensitive to labor, fuel, route density and procurement competition. The full report benchmarks collection pricing, tipping fees, treatment charges, hazardous-waste premiums, recycling economics, logistics costs, fuel surcharges and regional pricing, separating capacity-driven premiums from cost-driven pricing.
Where Are Capacity Shortfalls Creating the Largest Waste Management Growth Opportunities?
Roughly one-third of municipal waste is estimated to be inadequately managed. Mature markets face landfill scarcity, recycling bottlenecks and shortages of specialized treatment, while emerging markets face more basic gaps in collection coverage, transfer infrastructure and controlled disposal.
Our analysis indicates that capacity availability, not waste generation alone, determines how much volume becomes monetizable. In mature markets, limited permitted capacity supports utilization and pricing. In emerging markets the opportunity is larger but depends on building basic collection and treatment networks. Announced additions, project lead times, utilization and permitting will set the pace at which volumes convert into formal revenue.
In our view, infrastructure scarcity is both a growth opportunity and an execution constraint, as long development timelines and high capital needs delay supply responses. The full report benchmarks waste generation against collection coverage, landfill, recycling and treatment capacity, utilization, announced projects, regional deficits and investment requirements to identify the largest supply-demand gaps by geography and waste stream.
Where Do the Highest-Value Profit Pools and Bottlenecks Exist Across the Value Chain?
The value chain runs from generation, segregation and collection through transfer, transport, sorting, recycling, treatment, energy recovery and disposal. Collection is labor- and fleet-intensive, landfill economics depend on permitted capacity and remaining life, and recycling depends on yields, contamination and commodity prices. Hazardous-waste treatment and waste-to-energy require specialized infrastructure, compliance and reliable feedstock, plus energy offtake in the latter case.
Our analysis indicates that advantage is concentrating around asset control, network density and the ability to capture value beyond basic collection. Dense routes improve economics and retention, and permitted assets create entry barriers. Automation improves recycling yields, but commodity volatility remains a key margin risk. Vertically integrated operators can capture more of the value pool by linking collection with transfer, processing, recovery and disposal.
In our view, control points across the chain determine both pricing power and margin resilience. The full report evaluates cost contributions, margin pools, logistics economics, supplier concentration, vertical integration, asset ownership and bottlenecks at each stage.
Which Technologies Are Most Likely to Increase Recovery Rates, Operating Efficiency and Value per Tonne?
The industry is moving from basic mechanization toward AI-enabled sorting, computer vision, robotics, smart containers, digital fleet management and advanced recovery. Automation matters most where labor costs are high or contamination depresses yields, and route optimization reduces travel, fuel use and collection time. At the treatment stage, anaerobic digestion, landfill-gas recovery, waste-to-energy and advanced recycling expand the range of saleable outputs.
Our analysis indicates that commercial impact depends less on adoption than on measurable gains in throughput, recovery yield, operating cost or output value. Technologies that visibly improve cost per tonne, recovery or contamination levels will be adopted faster than those whose benefits remain experimental.
In our view, technology is becoming a margin and capacity lever rather than an operational upgrade. Operators that pair automation with sufficient volumes, reliable data and downstream markets can raise value per tonne without proportional growth in physical volume. The full report benchmarks maturity, adoption, patents, investment, deployment, efficiency and cost reductions across collection, sorting, recycling, treatment and energy recovery.
How Are EPR, Landfill Diversion and Circular-Economy Policies Reshaping Waste Management Economics?
Regulation is shifting the industry from disposal toward collection, recovery, recycling and traceable treatment. EPR, recycling targets, diversion requirements, methane-reduction policies and traceability rules expand formal obligations and demand for compliant infrastructure. E-waste shows the scale of the gap: about 62 million tonnes were generated globally in 2022, and only around 22% was formally collected and recycled.
Our analysis indicates that regulation is reallocating value toward operators that can document recovery, treatment and compliance outcomes. EPR creates dedicated funding and collection mechanisms, and landfill restrictions redirect volumes to recycling, composting, anaerobic digestion and waste-to-energy. Compliance costs, reporting burdens, infrastructure availability and uneven national implementation affect the speed and economics of the transition.
In our view, compliance is becoming a source of differentiation and infrastructure demand. Operators with permitted facilities, traceability systems, specialized recovery capability and established compliance relationships are best placed to capture the opportunities created by tightening rules. The full report assesses EPR schemes, targets, diversion rules, methane policy and traceability requirements by region and waste stream, and their effect on revenue mix.
Which Customer Segments, Contract Structures and Switching Barriers Define Demand?
Municipalities remain the core demand base, with recurring needs and long-term procurement. Commercial, manufacturing, construction, healthcare, retail and technology customers generate increasingly specialized demand in recycling, hazardous waste, e-waste management, organics and compliance services. Routes to market include municipal contracts, recurring commercial accounts, industrial relationships, direct sales and national-account platforms.
Our analysis indicates that customer value is driven by service complexity and compliance needs rather than volume. Municipal contracts give scale and recurring revenue but are price-sensitive and competitively tendered. Industrial and specialized customers require treatment, reporting and traceability, and switching can involve disruption, documentation and waste-profile requalification. Switching barriers therefore come from contractual, operational and service-integration factors, not contract length alone.
In our view, a two-tier demand structure is emerging: municipalities provide scale and base demand, while industrial and specialized generators offer higher-value, differentiated services. Dense networks and broad portfolios reinforce each other through route economics, retention and cross-selling. The full report evaluates segment shares, customer concentration, procurement models, contract duration, renewal cycles, switching costs and purchasing criteria across municipal, commercial, industrial, healthcare, construction, retail, electronics and hazardous segments.
How Fragmented is the Market, and Where Are Scale and Density Advantages Translating Into Share?
The market is structurally fragmented because collection systems, municipal contracts and permitted infrastructure are largely regional. At the same time, consolidation is rising as operators acquire routes, transfer stations, landfills, recycling assets and specialized platforms. Even large multinationals hold a limited share of global revenue, though they can be dominant in countries, metro areas or waste streams.
Our analysis indicates that advantage depends on asset density, network integration and complex-stream capability rather than scale alone, and that concentration should be assessed at global, regional and service levels. Company share is most meaningful when based on waste-relevant revenue, and a company can gain strategic share without changing its global position.
In our view, three archetypes are emerging: scaled integrated operators, regionally dense collection platforms and specialized high-value treatment providers. The full report estimates company share where revenue data allows, benchmarks Top-5 and Top-10 concentration by region and service, and separates organic from acquisition-led growth.
Leading Company Universe: 25 Companies Represent the Core Competitive Scope (Tentative)
| No | Company | HQ | Market Position | Core Strength |
| 1 | Waste Management | U.S. | Global-scale operator | Collection, landfill, recycling |
| 2 | Republic Services | U.S. | Major integrated operator | Collection, recycling, disposal |
| 3 | Veolia | France | Global environmental platform | Waste treatment and recovery |
| 4 | SUEZ | France | Global environmental operator | Waste recovery and treatment |
| 5 | Waste Connections | U.S./Canada | Major regional operator | Collection and disposal |
| 6 | Clean Harbors | U.S. | Hazardous-waste specialist | Hazardous and industrial waste |
| 7 | GFL Environmental | Canada | Integrated operator | Solid and environmental waste |
| 8 | REMONDIS | Germany | European operator | Recycling and recovery |
| 9 | FCC Environment | Spain | European operator | Municipal waste |
| 10 | Renewi | UK/Netherlands | Circularity specialist | Recycling and recovery |
| 11 | Biffa | UK | Integrated operator | Collection and recycling |
| 12 | Urbaser | Spain | Municipal operator | Collection and treatment |
| 13 | ALBA Group | Germany | Recycling specialist | Materials recovery |
| 14 | PreZero | Germany | Integrated operator | Collection and recycling |
| 15 | Paprec Group | France | Recycling specialist | Materials recovery |
| 16 | China Everbright Environment | China | Asia-scale operator | Waste-to-energy |
| 17 | China Tianying | China | Integrated operator | Waste treatment |
| 18 | Grandblue Environment | China | Regional operator | Municipal waste and WtE |
| 19 | Cleanaway Waste Management | Australia | Australian operator | Collection and disposal |
| 20 | Daiseki | Japan | Industrial-waste specialist | Recycling and treatment |
| 21 | Casella Waste Systems | U.S. | Regional operator | Collection and recovery |
| 22 | Reworld (formerly Covanta) | U.S. | WtE specialist | Energy recovery |
| 23 | Indaver | Belgium | Treatment specialist | Hazardous waste and WtE |
| 24 | Recology | U.S. | Regional operator | Collection and recycling |
| 25 | Stericycle (now part of WM) | U.S. | Specialized waste operator | Regulated medical waste |
Which Capabilities Distinguish Leading Operators Across Scale, Profitability, Portfolio and Asset Intensity?
Operators differ in revenue scale, growth, EBITDA margin, landfill exposure, recycling capacity, geographic coverage, technology adoption, M&A activity and portfolio mix across municipal, commercial, industrial, hazardous, healthcare, C&D, e-waste, organics and energy recovery. Competitive capacity increasingly depends on permitted, well-located infrastructure, including landfills, recycling plants, transfer stations, treatment plants, waste-to-energy facilities and hazardous-waste assets.
Our analysis indicates that scale alone does not explain strength. Higher performers combine network density or infrastructure ownership with attractive waste-stream exposure, efficient operations and integration skill. Capacity creates the most value when matched with local volumes, since underutilized assets dilute returns through fixed costs. Portfolio breadth helps where it raises retention and utilization, while specialization wins where compliance and treatment needs are high.
In our view, operators are separated by which combination of capabilities they can monetize best, and scarce, well-located compliant infrastructure can form a durable moat where permitting is slow and capital intensive. The full report benchmarks revenue, growth, EBITDA, margins, facilities, capacity, utilization, remaining landfill life, fleet size, planned additions, portfolio breadth, technology, R&D and sustainability investment.
How Do Regional Infrastructure, Regulation and Market Maturity Shape Competitive Strategies?
North America is defined by dense collection networks, landfill ownership and established contracting. Europe emphasizes recycling, circularity, recovery and compliance. Asia combines fast-rising volumes with gaps in collection, sorting and treatment, creating capacity opportunities alongside execution and localization challenges.
What is the Asia Pacific Waste Management Market Size?
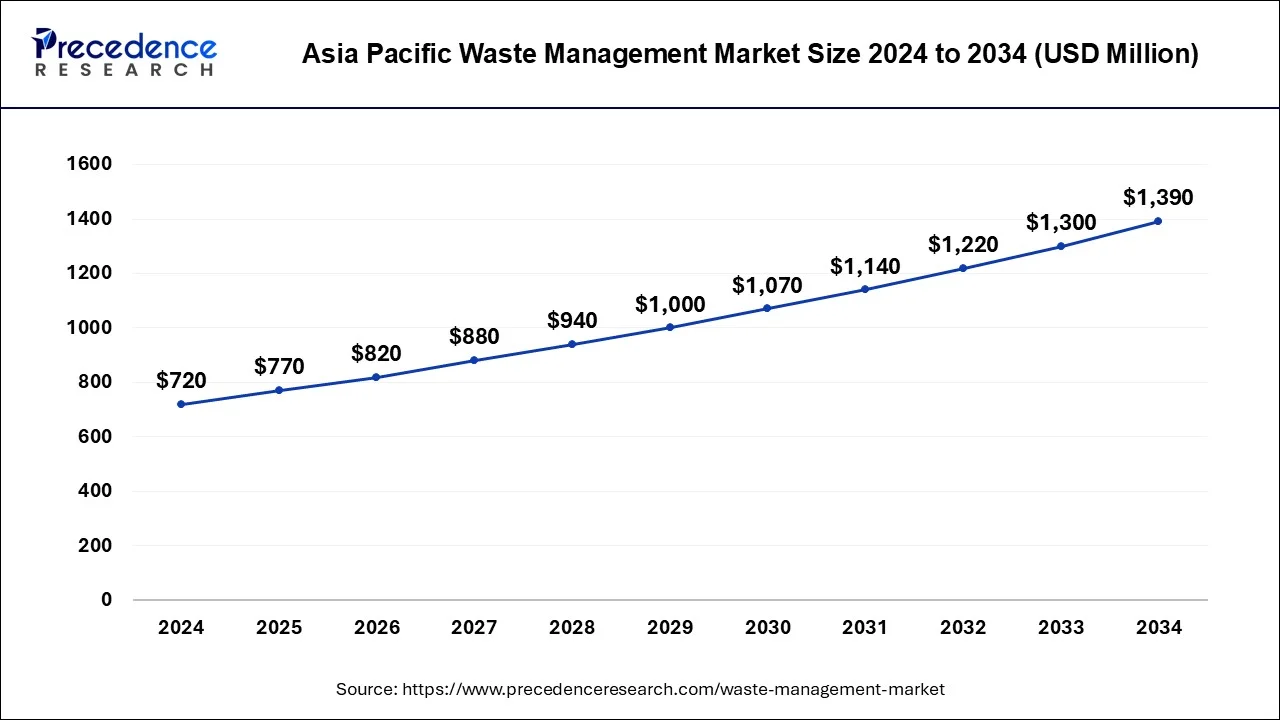
The Asia Pacific waste management market size is exhibited at USD 770 billion in 2025 and is projected to be worth around USD 1,473.33 billion by 2035, growing at a CAGR of 6.70% from 2026 to 2035.
Our analysis indicates that the same competitive model does not carry across regions. North American strength rests on density, permitted disposal and utilization. European operators need recycling, treatment and compliance capability to benefit from diversion. In Asia, advantage depends on infrastructure development, local partnerships and project execution.
In our view, expansion requires capability localization rather than replication: mature-market entrants need specialized recovery and compliance skills, while developing-market entrants must invest in collection, transfer and treatment. The full report benchmarks regional revenue, facilities, capacity, partnerships, acquisitions and expansion priorities.
Which Strategic Moves and M&A Themes Are Reshaping Competitive Priorities?
Recent activity centers on collection-route expansion, landfill and transfer assets, recycling capacity, hazardous-waste treatment, renewable natural gas, waste-to-energy, digital systems and circular-economy capability. M&A provides immediate access to density, permitted infrastructure and specialized capability that greenfield development would take years to replicate.
Our analysis indicates that investment is being used to control critical points in the value chain. Route acquisitions raise density, treatment and recycling purchases add higher-value capability, RNG and waste-to-energy create value from residuals, and digital systems lift fleet productivity. Consolidation is likely to stay focused on assets that deliver measurable scale, capacity or circularity advantages rather than unrelated diversification.
In our view, positioning will depend on the mix of organic investment, targeted acquisitions and technology-led modernization. The full report tracks developments over the latest 2-3 years, including launches, openings, expansions, partnerships, joint ventures and acquisitions, and analyzes each deal's acquirer, target, year, value, geography, waste stream, capability acquired and rationale.
Which External Forces Are Most Likely to Reshape Waste Management Economics and Investment Priorities?
Economics are shaped by public procurement, infrastructutexre spending, cost inflation, urbanization, commodity prices, technology and environmental rules. Political decisions drive municipal spending, EPR and permitting. Economic conditions drive fuel, labor, construction activity and recovered-material prices. Social trends such as consumption, recycling participation and acceptance of new facilities affect volumes and siting feasibility.
Our analysis indicates that these forces interact. Urbanization lifts volumes, regulation raises the share needing formal treatment, and technology improves processing economics, while inflation and fuel costs squeeze collection margins and commodity swings affect recovery value. Regulatory pressure will reinforce investment in recycling, recovery, methane reduction and diversion, but outcomes depend on infrastructure, procurement and project economics.
In our view, exposure varies by geography, waste stream and business model: integrated operators face budgets, fuel, commodities and compliance together, while specialists can benefit from stricter hazardous, recycling and recovery rules. The full report applies a PESTLE framework to growth, operating costs, investment, technology adoption, permitting and compliance.
How Will Waste Management Evolve From "Collect and Dispose" Toward "Recover, Monetize and Decarbonize" Through 2026-2035?
Through 2026-2035, the market is expected to integrate collection, recycling, recovery, specialized treatment, digital tracking, and circular services. The base case assumes continued growth, gradual landfill diversion, rising recycling intensity, treatment expansion, and ongoing consolidation.
Our analysis indicates that evolution will depend less on volume growth and more on how much value is extracted per managed tonne. The upside case assumes faster EPR rollout, stronger recovery, more infrastructure investment and quicker adoption of automation and advanced treatment. The downside case reflects slower municipal spending, weaker recovered-material prices, permitting delays and slower regulation.
In our view, new profit pools are emerging beyond collection and disposal: specialized treatment, hazardous waste, recycling infrastructure, organics, RNG, waste-to-energy, digital optimization and integrated collection-and-treatment networks. The full report develops base, upside and downside scenarios through 2026-2035, covering demand, capacity needs, technology adoption, regulation, consolidation and regional growth.
Recent Developments
- In May 2025, Ahmedabad Municipal Corporation (AMC) relaunched its E-Waste Collection Service 2.0, appointing three authorized agencies for doorstep e-waste pickup. Residents can schedule collections through linked online portals and receive compensation for discarded electronic items, strengthening the city's formal recycling ecosystem. (Source: Latest News, Breaking News, Today Headlines, India News, Top Stories at Free Press Journal)
- In May 2025, Pune launched India's first e-pushcart pilot to support waste pickers by electrifying traditional collection carts. The initiative reduces physical strain, improves collection efficiency, and promotes sustainable, technology-driven urban waste management while enhancing workers' livelihoods. (Source: Click, call, discard: AMC launches e-waste collection service 2.0 | Ahmedabad News - Times of India)
- In February 2025, India inaugurated its first indigenous automated biomedical waste treatment plant, enhancing scientific disposal of infectious healthcare waste. The initiative strengthens waste treatment infrastructure, improves environmental safety, and supports sustainable management of biomedical waste across healthcare facilities. (Source: https://punemirror.com)
Segments Covered in the Report
By Waste Type
- Hazardous Waste
- E-waste
- Municipal Waste
- Plastic Waste
- Industrial Waste
- Others
By Service Type
- Collection
- Open Dumping
- Incineration/Combustion
- Landfill
- Recycling
By End User
- Residential
- Commercial
- Industrial
By Geography
- North America
- Latin America
- Europe
- Asia-pacific
- Middle and East Africa
For inquiries regarding discounts, bulk purchases, or customization requests, please contact us at sales@precedenceresearch.com
Frequently Asked Questions





Ask For Sample
No cookie-cutter, only authentic analysis – take the 1st step to become a Precedence Research client
 Get a Sample




 sales@precedenceresearch.com
 Schedule a Meeting