Europe MICE Market Size is USD 522.05 Billion in 2026
Europe MICE Market (Event Type (Meetings, Incentives, Conferences, Exhibitions); Booking Mode (Direct Booking, OTAs, DMCs, TMCs, Others); Meeting Size (50–149, 150–249, 250–499, 500–999, 1000–1999, 2000–2999, 3000 & Above); Event Theme (Pharmaceutical & Biotechnology, Scientific & Academic Research, Technology & Digital Innovation, Finance & Banking, Engineering & Industrial Technologies, Trade & Industry Exhibitions, Others).) Industry Size, Share, Growth, Trends 2026 to 2035.


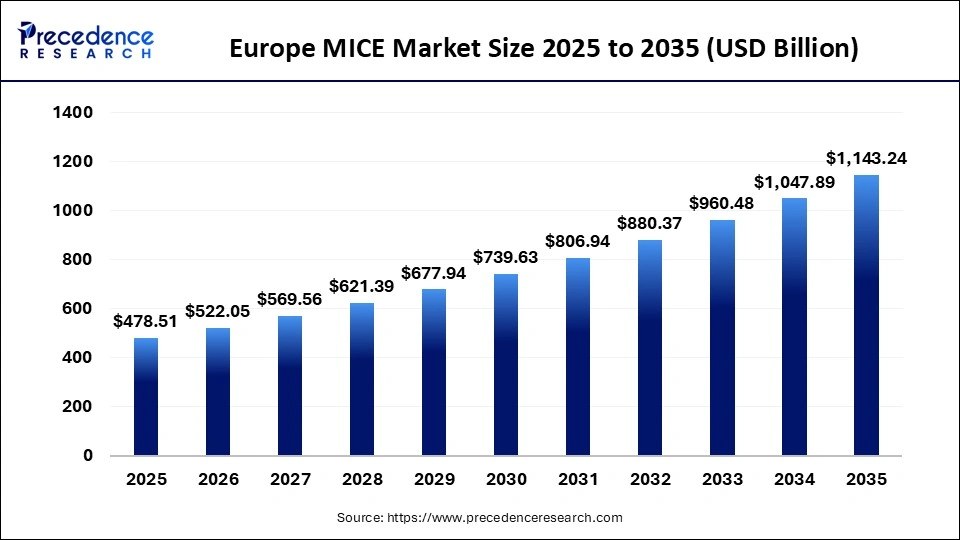
The Europe MICE market size was estimated at USD 478.51 billion in 2025 and is expanding at a CAGR of 9.10% from 2026 to 2035. The growth of multinational corporations is significantly driving this market in Europe.
Europe MICE Market Statical Scope
| Reports Attributes | Statistics |
| Market Size in 2025 | USD 478.51 Billion |
| Market Size in 2026 | USD 522.05 Billion |
| Market Size by 2035 | USD 941.3 Billion |
| CAGR 2026 to 2035 | 9.1% |
| Base Year | 2025 |
| Forecast Period | 2026 to 2035 |
MICE, which includes travel for meetings (M), incentives (I), conferences (C), and exhibitions (E), is thriving, with the conference market being particularly lucrative. The United Kingdom and Germany are the largest markets in Europe for MICE tourism.
Europe has long been recognized as a global hub for business events, due to its concentration of international corporations, well-developed transport infrastructure, and a strong culture of professional congresses and trade fairs. Corporate incentive travel programs are also contributing to the growth of the European MICE industry, as companies increasingly use travel-based rewards to motivate employees, recognize sales achievements, and strengthen team engagement.
Europe MICE Market Share, By Country, 2025
- Germany- Germany is a global leader in the MICE sector, renowned for its exceptional infrastructure, strategic central European location, and a long-standing tradition of hosting world-class events. The market is characterized by a high level of professionalism, advanced technological integration, and a strong commitment to sustainability, making it an attractive destination for both international and domestic business events.
Europe Seasoning Market Share, By Product, 2025, (%)
| Segments | Shares (%) |
| Spices | 65% |
| Herbs | 20% |
| Salt & Salt Substitutes | 15% |
- Spices- the spices segment holds a 65% share of the market, due to extensive use in diverse cuisines and strong consumer demand for flavor enhancement.
- Herbs- rising demand for fresh, natural, and plant-based ingredients to avoid salt and fats, making herbs a preferred choice with 20% share.
- Salt and salt substitutes- demand is driven by rising health concerns, particularly hypertension, prompting a shift toward low-sodium alternatives with 15% share.
Europe Seasoning Market Share, By End Use, 2025, (%)
| Segments | Shares (%) |
| Retail | 78% |
| Foodservice | 22% |
- Retail- It dominates because of high household consumption and frequent purchases for daily cooking, contributing a 78 % share in the market.
- Foodservice- foodservice outlets have been widely using herbs and spices due to constantly changing food and beverage trends, and holds 22% share.
Europe Seasoning Market Share, By Brand, 2025, (%)
| Segments | Shares (%) |
| National Brand | 83% |
| Private Label | 17% |
- National brand- national brand holds 83% share of the market due to strong brand recognition, quality assurance, and wide distribution networks.
- Private label- private label brands are growing with 17% due to affordably priced products that offer good quality.
Top Companies in the Europe MICE Market
- CWT Meetings & Events
- BCD Meetings & Events
- Maritz
- Conference Care
- ATPI Ltd.
- FCM Meetings & Events
- Global Cynergies, LLC
- Capita plc
- AVIAREPS AG
Segments Covered in the Report
By Event Type
- Meetings
- Incentives
- Conferences
- Exhibitions
By Booking Mode
- Direct Booking
- Online Travel Agents and Agencies (OTAs)
- Destination Management Companies (DMCs)
- Travel Management Companies (TMCs)
- Others
By Meeting Size
- From 50 to 149
- From 150 to 249
- From 250 to 499
- From 500 to 999
- From 1000 to 1999
- From 2000 to 2999
- From 3000 & Above
By Event Theme
- Pharmaceutical & Biotechnology
- Scientific & Academic Research (STM)
- Technology & Digital Innovation
- Finance, Investment & Banking
- Engineering, Manufacturing & Industrial Technologies
- Trade & Industry Exhibitions
- Others
| Event Type | 2025 | 2026 | 2027 | 2028 | 2029 | 2030 | 2031 | 2032 | 2033 | 2034 | 2035 |
|---|---|---|---|---|---|---|---|---|---|---|---|
| Meetings | 167.48 | 182.72 | 199.35 | 217.49 | 237.28 | 258.87 | 282.43 | 308.13 | 336.17 | 366.76 | 400.14 |
| Incentives | 71.78 | 78.31 | 85.43 | 93.21 | 101.69 | 110.94 | 121.04 | 132.06 | 144.07 | 157.18 | 171.49 |
| Conferences | 119.63 | 130.51 | 142.39 | 155.35 | 169.48 | 184.91 | 201.73 | 220.09 | 240.12 | 261.97 | 285.81 |
| Exhibitions | 119.63 | 130.51 | 142.39 | 155.35 | 169.48 | 184.91 | 201.73 | 220.09 | 240.12 | 261.97 | 285.81 |
| Booking Mode | 2025 | 2026 | 2027 | 2028 | 2029 | 2030 | 2031 | 2032 | 2033 | 2034 | 2035 |
|---|---|---|---|---|---|---|---|---|---|---|---|
| Direct Booking | 143.55 | 156.62 | 170.87 | 186.42 | 203.38 | 221.89 | 242.08 | 264.11 | 288.14 | 314.37 | 342.97 |
| Online Travel Agents & Agencies | 119.63 | 130.51 | 142.39 | 155.35 | 169.48 | 184.91 | 201.73 | 220.09 | 240.12 | 261.97 | 285.81 |
| Destination Management Companies | 71.78 | 78.31 | 85.43 | 93.21 | 101.69 | 110.94 | 121.04 | 132.06 | 144.07 | 157.18 | 171.49 |
| Travel Management Companies | 95.70 | 104.41 | 113.91 | 124.28 | 135.59 | 147.93 | 161.39 | 176.07 | 192.10 | 209.58 | 228.65 |
| Others | 47.85 | 52.21 | 56.96 | 62.14 | 67.79 | 73.96 | 80.69 | 88.04 | 96.05 | 104.79 | 114.32 |
Research Methodology
Related Databooks
March 2026
March 2026
March 2026
March 2026

 sales@precedenceresearch.com
 +1 804-441-9344
 Download Databook
 Schedule a Meeting