Middle East Clinical Nutrition Market Size is USD 1,328.56 Million in 2026
Middle East Clinical Nutrition Market (By Product: Oral Clinical Nutrition, Parenteral Nutrition, Enteral Feeding Formulas; By Application: Alzheimer’s, Nutrition Deficiency, Cancer Care, Diabetes, Chronic Kidney Diseases, Orphan Diseases, Dysphagia, Pain Management, Malabsorption/GI Disorder/Diarrhea, Others; By Sales Channel: Online Sales Channels, Retail Sales Channel, Institutional Sales Channel) Industry Size, Share, Growth, Trends 2026 to 2035.


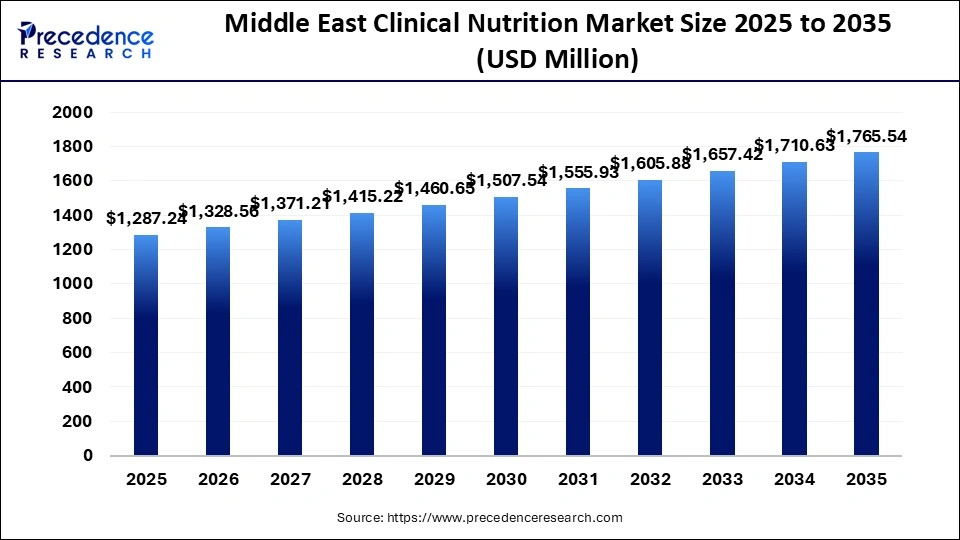
The Middle East clinical nutrition market size was estimated at USD 1287.24 million in 2025 and is expanding at a CAGR of 3.21% from 2026 to 2035. The growing burden of chronic diseases and increasing healthcare infrastructure are driving the market.
Middle East Clinical Nutrition Market Statical Scope
| Reports Attributes | Statistics |
| Market Size in 2025 | USD 1,287.24 Million |
| Market Size in 2026 | USD 1,328.56 Million |
| Market Size by 2035 | USD 1,765.54 Million |
| CAGR 2026 to 2035 | 3.21% |
| Base Year | 2025 |
| Forecast Period | 2026 to 2035 |
The aging population in Gulf Cooperation Council countries has complex nutritional needs, contributing to a rising incidence of non-communicable diseases such as diabetes, cardiovascular diseases, and obesity. This is creating a demand for specialized nutrition products. There is also increasing awareness of the role of clinical nutrition in patient recovery and chronic disease management, along with government initiatives to promote healthcare infrastructure and nutritional awareness campaigns.
Middle East Clinical Nutrition Market Share, By Country, 2025
- UAE - The UAE clinical nutrition market is projected to experience substantial growth, driven by the rising prevalence of chronic diseases, expanding healthcare infrastructure, and government initiatives. Key trends include a shift towards plant-based nutrition, technology integration, and personalized nutrition solutions.
Middle East Clinical Nutrition Market Share, By Product, 2025, (%)
| Segments | Shares (%) |
| Oral Clinical Nutrition | 45% |
| Enteral Feeding Formulas | 30% |
| Parenteral Nutrition | 25% |
- Oral Clinical Nutrition - drives the largest product segment and, with a 45% share, is widely preferred for ease of administration and patient compliance.
- Enteral Feeding Formulas - They support tube feeding and, with a 30% share, are expanding due to rising hospital and home care adoption.
- Parenteral Nutrition - increasing prevalence of gastrointestinal and chronic disorders and increasing premature births are driving this segment, with 25% share.
Middle East Clinical Nutrition Market Share, By Application, 2025, (%)
| Segments | Shares (%) |
| Nutrition deficiency | 20% |
| Cancer care | 15% |
| Diabetes | 12% |
| Chronic Kidney Diseases | 10% |
| Orphan Diseases | 5% |
| Dysphagia | 11% |
| Pain Management | 9% |
| Malabsorption/GI Disorder/Diarrhea | 10% |
| Others | 8% |
- Nutrition deficiency - segment is driven by preventive and corrective nutrition demands, with a 20% share, and shows significant growth potential.
- Cancer care - this segment is growing with 15% share due to the rising burden of patients affected by various types of cancer.
- Diabetes - Increasing cases of type 2 diabetes and sedentary lifestyles are boosting demand for specialized clinical nutrition, with 12% share.
- Chronic Kidney Diseases - rising prevalence of renal diseases and the demand for specialized nutritional management contribute to 10% share.
- Orphan Diseases - Rare disease applications with limited patient base, with a 5% share, restrict broader market contribution.
- Dysphagia - Need for modified texture nutrition, with a 11% share, supports the market but remains limited.
- Pain Management - Limited role of nutrition in pain-related care, with a 9% share, remains niche.
- Malabsorption/GI Disorder/Diarrhea - Use in digestive disorder management, with a 10% share, supports but remains below leading segments.
- Others - Includes various smaller applications, with a 8% share, result in moderate contribution.
Middle East Clinical Nutrition Market Share, By Sales Channel, 2025, (%)
| Segments | Shares (%) |
| Retail sales channel | 50% |
| Online Sales Channels | 20% |
| Institutional Sales Channel | 30% |
- Retail sales channel - It drives the largest distribution with a 50% share, driven by easy accessibility.
- Online Sales Channels - growing consumer demand for convenience, privacy, and direct-to-doorstep delivery is driving the growth of this segment, and holds 20% share.
- Institutional Sales Channel - this segment is expanding due to purchases from hospitals, long-term care centers, and nursing homes, with 30% share.
Top Companies in the Middle East Clinical Nutrition Market
- AbbVie Inc.
- Grifols, S.A.
- Abbott
- Pfizer Inc.
- Bayer AG
- Nestlé
- Reckitt Benckiser Group plc
- Fresenius Kabi AG
- Medtrition Middle East, LLC.
- Dr Nutrition UAE
Segments Covered in the Report
By Product
- Oral Clinical Nutrition
- Parenteral Nutrition
- Enteral Feeding Formulas
By Application
- Alzheimer's
- Nutrition Deficiency
- Cancer Care
- Diabetes
- Chronic Kidney Diseases
- Orphan Diseases
- Dysphagia
- Pain Management
- Malabsorption/GI Disorder/Diarrhea
- Others
By Sales Channel
- Online Sales Channels
- Retail Sales Channel
- Institutional Sales Channel
| Product | 2025 | 2026 | 2027 | 2028 | 2029 | 2030 | 2031 | 2032 | 2033 | 2034 | 2035 |
|---|---|---|---|---|---|---|---|---|---|---|---|
| Oral Clinical Nutrition | 579.26 | 600.51 | 622.53 | 645.34 | 668.98 | 693.47 | 718.84 | 745.13 | 772.36 | 800.57 | 829.80 |
| Parenteral Nutrition | 386.17 | 397.24 | 408.62 | 420.32 | 432.35 | 444.72 | 457.44 | 470.52 | 483.97 | 497.79 | 512.01 |
| Enteral Feeding Formulas | 321.81 | 330.81 | 340.06 | 349.56 | 359.32 | 369.35 | 379.65 | 390.23 | 401.10 | 412.26 | 423.73 |
| Sales Channel | 2025 | 2026 | 2027 | 2028 | 2029 | 2030 | 2031 | 2032 | 2033 | 2034 | 2035 |
|---|---|---|---|---|---|---|---|---|---|---|---|
| Online Sales Channels | 193.09 | 203.27 | 213.91 | 225.02 | 236.63 | 248.74 | 261.40 | 274.60 | 288.39 | 302.78 | 317.80 |
| Retail Sales Channel | 450.53 | 463.67 | 477.18 | 491.08 | 505.39 | 520.10 | 535.24 | 550.82 | 566.84 | 583.32 | 600.28 |
| Institutional Sales Channel | 643.62 | 661.62 | 680.12 | 699.12 | 718.64 | 738.69 | 759.29 | 780.46 | 802.19 | 824.52 | 847.46 |
List of Tables & Figures
Research Methodology
Related Databooks
March 2026
March 2026
March 2026
March 2026

 sales@precedenceresearch.com
 +1 804-441-9344
 Download Databook
 Schedule a Meeting