Middle East Petrochemicals Market Size is USD 18.82 Billion in 2026
Middle East Petrochemicals Market (By Product: Ethylene, Propylene, Butadiene, Benzene, Xylene, Toluene, Methanol) Industry Size, Share, Growth, Trends 2026 to 2035.


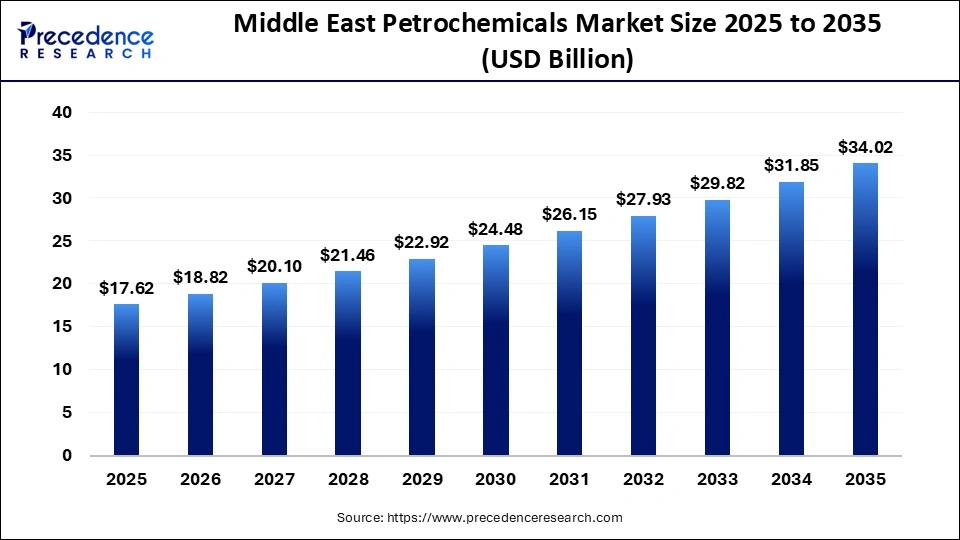
The Middle East petrochemicals market size was estimated at USD 17.62 billion in 2025 and is expanding at a CAGR of 6.80% from 2026 to 2035. Increasing demand for fuel and essential feedstocks is driving the market.
Middle East Petrochemicals Market Statical Scope
| Reports Attributes | Statistics |
| Market Size in 2025 | USD 17.62 Billion |
| Market Size in 2026 | USD 18.82 Billion |
| Market Size by 2035 | USD 34.02 Billion |
| CAGR 2026 to 2035 | 6.80% |
| Base Year | 2025 |
| Forecast Period | 2026 to 2035 |
The petrochemical industry in the Middle East is a vital component of the region's economy, leveraging its vast oil and gas resources to establish itself as a global petrochemical powerhouse. This sector not only drives economic growth and diversification but also plays a critical role in meeting global demand for essential materials utilized in various industries, such as construction, automotive, packaging, and healthcare.
In the Middle East, countries like Saudi Arabia and the UAE are experiencing a significant demand for petrochemicals, fueled by the need for construction in the residential, industrial, and commercial sectors. Technological advancements are instrumental in enhancing the competitiveness of the Middle East's petrochemical industry. Countries in the region are actively seeking partnerships with international firms to acquire advanced technologies and expertise in petrochemical processes.
Middle East Petrochemicals Market Share, By Country, 2025
- UAE - the petrochemicals market in the UAE is growing. This growth is largely driven by a rising demand for plastics and chemicals in the packaging, automotive, and construction sectors, alongside robust expansion in consumer goods and agriculture. The UAE's strategic investments in advanced petrochemical infrastructure and the adoption of Industry 4.0 technologies further support market expansion.
Middle East Petrochemicals Market Share, By Product, 2025, (%)
| Segments | Shares (%) |
| Ethylene | 30% |
| Propylene | 25% |
| Butadiene | 15% |
| Benzene | 10% |
| Xylene | 8% |
| Toluene | 7% |
| Methanol | 5% |
- Ethylene- strong demand as a key feedstock for plastics and chemicals production contributes a 30% share, establishing ethylene as the leading product segment in the Middle East petrochemicals market.
- Propylene- Propylene demand is rising with automotive, packaging, construction, and healthcare as leading end-use sectors, and accounts for 25% share.
- Butadiene- butadiene segment holds 15% share due to increasing demand in automotive, synthetic rubber, and chemicals.
- Benzene- the benzene segment is experiencing rising demand with 10% share for benzene in the petrochemical sector, significantly for the production of cumene, styrene, and cyclohexane derivatives.
- Xylene- xylene accounts for 8% market share due to regional petroleum abundance and tremendous petrochemical infrastructure investments.
- Toluene - Includes various smaller applications, with a 7% share, result in limited overall contribution.
- Methanol- Includes various smaller applications, with a 5% share, result in limited overall contribution.
Top Companies in the Middle East Nanocatings Market
- SABIC
- Exxon Mobil Corporation
- Chevron Lummus Global (CLG)
- Kinetic Technologies
- Linde PLC
- Sipchem Company
- Saudi Arabian Oil Co.
- Tasnee
- INEOS AG
- Shell Global
Segments Covered in the Report
By Product
- Ethylene
- Propylene
- Butadiene
- Benzene
- Xylene
- Toluene
- Methanol
| Product | 2025 | 2026 | 2027 | 2028 | 2029 | 2030 | 2031 | 2032 | 2033 | 2034 | 2035 |
|---|---|---|---|---|---|---|---|---|---|---|---|
| Ethylene | 5.20 | 5.49 | 5.81 | 6.15 | 6.51 | 6.88 | 7.27 | 7.67 | 8.09 | 8.53 | 9.36 |
| Propylene | 3.17 | 3.40 | 3.66 | 3.94 | 4.24 | 4.53 | 4.84 | 5.17 | 5.52 | 5.89 | 6.30 |
| Butadiene | 1.41 | 1.49 | 1.58 | 1.68 | 1.77 | 1.86 | 1.95 | 2.05 | 2.16 | 2.27 | 2.38 |
| Benzene | 1.94 | 2.09 | 2.24 | 2.40 | 2.57 | 2.75 | 2.95 | 3.16 | 3.38 | 3.62 | 3.92 |
| Xylene | 1.76 | 1.91 | 2.07 | 2.24 | 2.41 | 2.60 | 2.80 | 3.01 | 3.24 | 3.48 | 3.75 |
| Toluene | 1.32 | 1.39 | 1.47 | 1.56 | 1.64 | 1.73 | 1.82 | 1.92 | 2.02 | 2.13 | 2.38 |
| Methanol | 2.82 | 3.05 | 3.27 | 3.50 | 3.79 | 4.14 | 4.53 | 4.96 | 5.43 | 5.95 | 6.95 |
Research Methodology
Related Databooks
March 2026
March 2026
April 2026
April 2026

 sales@precedenceresearch.com
 +1 804-441-9344
 Download Databook
 Schedule a Meeting