North America Rum Market Size is USD 4.46 Billion in 2026
North America Rum Market (By Product: Dark and Golden Rum, White Rum, Flavored and Spiced Rum, Others; By Distribution Channel: Off-trade, On-trade) Industry Size, Share, Growth, Trends 2026 to 2035.


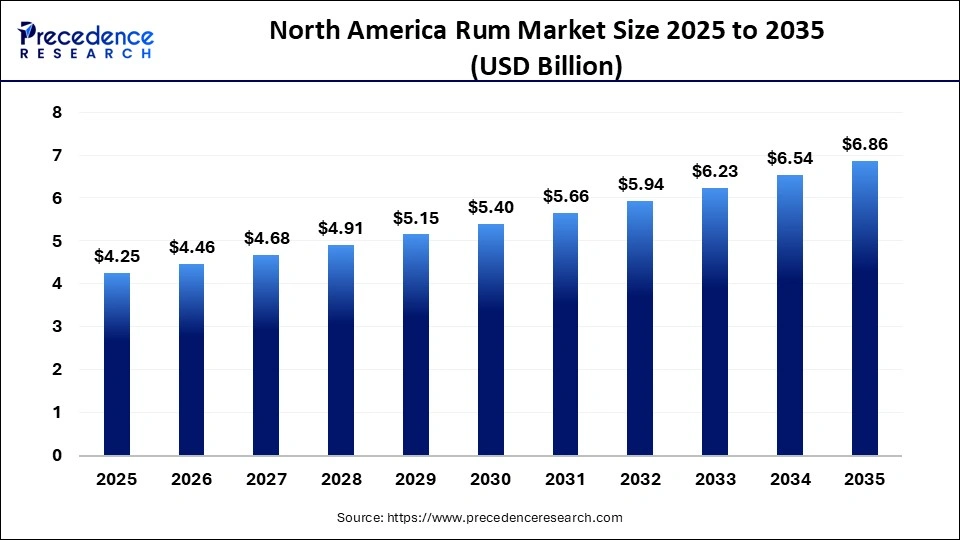
The North America rum market is expected to grow from USD 4.25 billion in 2025, with a satisfying CAGR of 4.9%. Due to rising consumer demands for premium flavoured and craft rums, increased cocktail culture, expanding retail and e- commerce availability, and shifting preference among younger consumers seeking unique and high -quality drinking experience.
U.S. Flavors Market Statical Scope
| Reports Attributes | Statistics |
| Market Size in 2025 | USD 4.25 Billion |
| Market Size in 2026 | USD 4.46 Billion |
| Market Size by 2035 | USD 6.86 Billion |
| CAGR 2026 to 2035 | 5.3% |
| Base Year | 2025 |
| Forecast Period | 2026 to 2035 |
Technology is playing an increasingly important role in the North American rum market, with producers adopting advanced distillation methods. Automated bolting system and digital tools to improve efficiency, consistency, and quality. These innovations help distillers optimise fermentation, aging, and flavour development, while an e-commerce platform and data analytics enhance distribution and consumer engagement.
However, the industry also faces risk, including regulatory complexities, supply chain challenges, and the need to balance traditional craftsman skills with modern production technologies, maintaining authenticity and managing technological challenges while meeting evolving consumer expectations, remains a key strategic consideration for rum producers.
North America Rum Market Share, By Application, 2025 (%)
| Segments | Shares (%) |
| Dark and Golden Rum | 48% |
| White Rum | 27% |
| Flavoured and Spiced Rum | 18% |
| Others | 7% |
- Dark and Golden Rum- The segment dominated the market with a 48% share, due to strong consumer preference for richer flavours and the rising popularity of premium products in North America.
- White Rum- The segment accounted for 27% of the total market share. It is widely used in cocktails, but its popularity is restrained by lower premium perception relative to darker options.
- Flavoured and Spiced Rum- The segment accounted for 18% of the total market share. Growth is driven by rising consumer enthusiasm for creative flavours and adventurous drinking choices.
- Others- The segment accounted for 7% of the total market share. Growth is constrained by niche Product dominance and limited consumer awareness across the wider market.
North America Rum Market Share, By Nature, 2025 (%)
| Segments | Shares (%) |
| Off-trade | 80% |
| On-trade | 20% |
- Off-trade- The segment dominated the market with a 80% share, its success is fueled by robust retail distribution and increasing at-home consumption trends.
- On-trade- The segment accounted for 20% of the total market share. It continues to expand alongside the revival of on-premises consumption and social drinking trends.
Top Companies in the North America Rum Market
- Bacardi Limited
- Davide Campari-Milano N.V.
- Demerara Distillers Ltd. (DDL)
- Diageo Plc
- LT Group Inc.
- Nova Scotia Spirit Co.
- Pernod Ricard SA
- Dictador Europe Sp. z o.o.
- William Grant & Sons Ltd.
- Mohan Meakin Limited
Segments Covered in the Report
By Product
- Dark and Golden Rum
- White Rum
- Flavored and Spiced Rum
- Others
By Distribution Channel
- Off-trade
- On-trade
| Product Segments | 2025 | 2026 | 2027 | 2028 | 2029 | 2030 | 2031 | 2032 | 2033 | 2034 | 2035 |
|---|---|---|---|---|---|---|---|---|---|---|---|
| Dark and Golden Rum | 1.70 | 1.82 | 1.93 | 2.05 | 2.18 | 2.31 | 2.45 | 2.60 | 2.76 | 2.93 | 3.11 |
| White Rum | 1.28 | 1.31 | 1.39 | 1.48 | 1.57 | 1.66 | 1.77 | 1.88 | 1.99 | 2.11 | 2.24 |
| Flavored and Spiced Rum | 0.85 | 0.94 | 0.99 | 1.06 | 1.12 | 1.19 | 1.26 | 1.34 | 1.42 | 1.51 | 1.60 |
| Others | 0.43 | 0.45 | 0.47 | 0.50 | 0.53 | 0.57 | 0.60 | 0.64 | 0.68 | 0.72 | 0.76 |
| Distribution Channels | 2025 | 2026 | 2027 | 2028 | 2029 | 2030 | 2031 | 2032 | 2033 | 2034 | 2035 |
|---|---|---|---|---|---|---|---|---|---|---|---|
| Off-trade | 2.55 | 2.73 | 2.90 | 3.07 | 3.26 | 3.47 | 3.68 | 3.91 | 4.15 | 4.40 | 4.67 |
| On-trade | 1.70 | 1.75 | 1.86 | 1.97 | 2.09 | 2.22 | 2.36 | 2.50 | 2.66 | 2.82 | 2.99 |
Research Methodology
Related Databooks
March 2026
April 2026
April 2026
April 2026

 sales@precedenceresearch.com
 +1 804-441-9344
 Download Databook
 Schedule a Meeting