North America Wheelchair Market Size is USD 2.28 Billion in 2026
North America Wheelchair Market (By Product: Electric: Electric, Manual; By Source: Adult, Pediatric; By Application: Food & Beverages, Healthcare) Industry Size, Share, Growth, Trends 2026 to 2035.


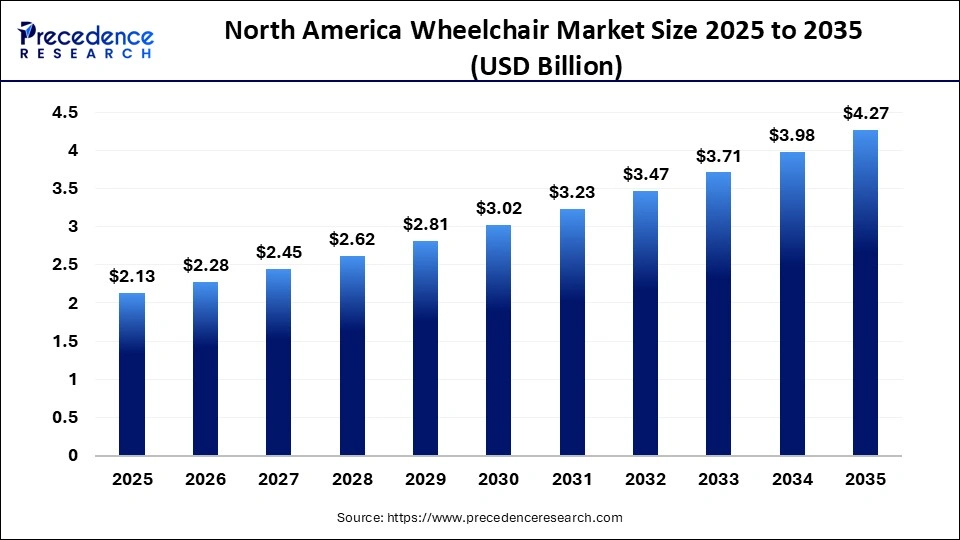
The North America wheelchair market size was estimated at USD 2.13 billion in 2025 and is predicted to increase from USD 2.28 billion in 2026 to approximately USD 4.27 billion by 2035, expanding at a CAGR of 7.2% from 2026 to 2035. North America has the largest wheelchair market globally, driven by an aging population, high disability rates, and a strong healthcare system.
North America Wheelchair Market Statical Scope
| Reports Attributes | Statistics |
| Market Size in 2025 | USD 2.13 Billion |
| Market Size in 2026 | USD 2.28 Billion |
| Market Size by 2035 | USD 4.27 Billion |
| CAGR 2026 to 2035 | 7.2% |
| Base Year | 2025 |
| Forecast Period | 2026 to 2035 |
Demand is steady due to investments in premium mobility options and favorable reimbursement policies for seniors and the injured. Millions of seniors aged 65 and older in the U.S. create a significant need for wheelchairs to address mobility and dementia issues. Healthcare investments and robust insurance, like Medicare and Medicaid, facilitate access to mobility devices, sustaining high sales.
The region leads in developing high-quality, lightweight, and smart powered wheelchairs due to strong R&D and consumer purchasing power. Increasing cases of strokes, arthritis, and spinal cord injuries heighten the need for rehabilitation, boosting demand for manual and motorized wheelchairs. Government initiatives and the ADA promote wheelchair adoption and compliance with accessibility standards.
North America Wheelchair Market, By Country. 2025 (%)
- U.S. – In the U.S., wheelchairs can be operated manually, either self-propelled or by an attendant, or through motorized electric motors that run on batteries. Powered chairs generally use joysticks or unique controls. New technologies are also emerging, including autonomous "self-driving" chairs at airports.
- Canada – In Canada, users can drive wheelchairs manually or, for power wheelchairs, with controls such as joysticks, head arrays, or chin controllers. Some advanced models utilize AI to understand user intent, and accessible vehicles have special hand controls that let users drive from their chair.
- Mexico – In Mexico, wheelchairs are operated in various ways to meet user needs and local conditions, including manual propulsion, electric motors, and specialized all-terrain models for rural areas, sometimes with caregiver assistance.
North America Wheelchair Market Share, By Product, 2025 (%)
| Segments | Shares (%) |
| Manual | 62% |
| Electric | 38% |
- Manual – This segment leads with 62% market share because of its low cost, user-friendliness, minimal upkeep, and broad acceptance in both personal and institutional environments.
- Electric - This segment is the fastest-growing, with 38% market share, as the rising need for mobility assistance, tech improvements, and enhanced comfort encourage adoption among older and disabled individuals.
North America Wheelchair Market Share, By Category, 2025 (%)
| Segments | Shares (%) |
| Adult | 70% |
| Pediatric | 30% |
- Rehabilitation Centers - This segment leads with 35% market share because of ongoing demand for mobility assistance during recovery, therapy, and long-term rehabilitation programs.
- Home care - This segment holds 30% market share, as it remains an important one, driven by growing preference for home care and patient independence.
- Hospitals- This segment is the fastest growing, with 25% market share, as more hospital admissions and investments in patient mobility infrastructure boost demand.
- Ambulatory Surgical Centers - This segment holds 10% market share, as its use is restricted to short-term patient mobility requirements.
Top Companies in the North America Wheelchair Market
- Nitta Gelatin, NA Inc.
- Weishardt
- Tessenderlo Group
- Gelita AG
- Rousselot
- PB Gelatins
- Collagen Solutions
- Gelnex
- Advanced BioMatrix
Segments Covered in the Report
By Product
- Manual
- Electric
By Source
- Adult
- Pediatric
By Application
- Food & Beverages
- Functional Food
- Functional Beverages
- Dietary Supplements
- Confectionary
- Desserts
- Meat Processing
- Healthcare
- Bone & Joint Health Supplements
- Wound Dressing
- Tissue Regeneration
- Medical Implants
- Cardiology
- Drug Delivery
- Cosmetics
- Beauty Supplements (Nutricosmetics)
- Topical Cosmetic Products
- Others
| Product | 2025 | 2026 | 2027 | 2028 | 2029 | 2030 | 2031 | 2032 | 2033 | 2034 | 2035 |
|---|---|---|---|---|---|---|---|---|---|---|---|
| Manual | 1.32 | 1.40 | 1.48 | 1.56 | 1.64 | 1.73 | 1.82 | 1.90 | 2.00 | 2.09 | 2.35 |
| Electric | 0.81 | 0.88 | 0.97 | 1.06 | 1.17 | 1.28 | 1.41 | 1.56 | 1.71 | 1.89 | 1.92 |
| Source | 2025 | 2026 | 2027 | 2028 | 2029 | 2030 | 2031 | 2032 | 2033 | 2034 | 2035 |
|---|---|---|---|---|---|---|---|---|---|---|---|
| Adult | 1.49 | 1.59 | 1.70 | 1.81 | 1.92 | 2.04 | 2.16 | 2.28 | 2.41 | 2.55 | 2.82 |
| Pediatric | 0.64 | 0.69 | 0.75 | 0.81 | 0.89 | 0.97 | 1.07 | 1.18 | 1.30 | 1.43 | 1.45 |
Research Methodology
Related Databooks
March 2026
March 2026
March 2026
March 2026

 sales@precedenceresearch.com
 +1 804-441-9344
 Download Databook
 Schedule a Meeting