U.S. Exoskeleton Market Size is USD 58.55 Million in 2026
U.S. Exoskeleton Market (By Mobility: Mobile, Fixed/Stationary; By Technology: Powered, Non-powered; By Extremity: Upper Body, Lower Body, Full Body; By End-use: Healthcare, Military, Industry) Industry Size, Share, Growth, Trends 2026 to 2035.


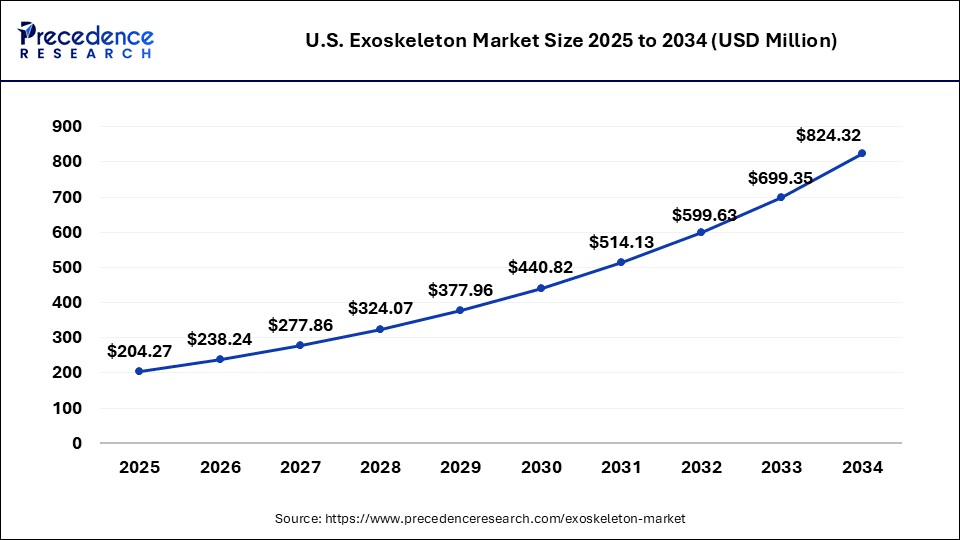
The U.S. exoskeleton market size was estimated at USD 51.72 million in 2025 and is predicted to increase from USD 58.55 million in 2026 to approximately USD 178.7 million by 2035, expanding at a CAGR of 13.2% from 2026 to 2035. The growing aging population, the rising use of medical devices, are driving the demand for exoskeletons in the U.S.
U.S. Exoskeleton Market Statical Scope
| Reports Attributes | Statistics |
| Market Size in 2025 | USD 51.72 Million |
| Market Size in 2026 | USD 58.55 Million |
| Market Size by 2035 | USD 178.7 Million |
| CAGR 2026 to 2035 | 13.2% |
| Base Year | 2025 |
| Forecast Period | 2026 to 2035 |
The exoskeleton market encompasses the entire industry involved in the manufacture, development, and commercialization of exoskeletons designed to enhance the mobility of individuals with physical disabilities. An exoskeleton is a rigid covering found on many animals, primarily invertebrates like molluscs.
The growth of the U.S. exoskeleton market is driven by recommendations for patients with spinal cord injuries to use exoskeletons to improve their condition. The market for these devices is expanding due to the rising incidence of spinal cord injuries, which is now a key factor influencing both patient and healthcare professional acceptance of exoskeletons. Demand for exoskeletons is predicted to increase as a result of rapid technological advancements in the market, which are enhancing acceptance and popularity among various industries.
Exoskeleton solutions are increasingly adopted to aid mobility restoration and rehabilitation, particularly for individuals with spinal cord injuries. In the U.S., ongoing innovation in wearable robotics is prompting manufacturers to introduce next-generation systems with improved personalization and digital integration.
U.S. Exoskeleton Market Share, By Mobility, 2025 (%)
| Segments | Shares (%) |
| Mobile | 63% |
| Fixed/Stationary | 37% |
- Mobile: leads the market with 63% because of high flexibility, real-world usability, and strong adoption across healthcare and industrial applications.
- Fixed/Stationary: this segment is growing fastest with 37%, due to rising demand in rehabilitation centers and controlled industrial environments needing precision support.
U.S. Exoskeleton Market Share, By Price Range, 2025, (%)
| Segments | Shares (%) |
| Powered | 73% |
| Non-Powered | 27% |
- Powered: The powered segment dominates the market at 73% because of improved performance and widespread utilization across healthcare, the military, and industry.
- Non-Powered: the non-powered segment is growing at the fastest rate of 27%, due to the demand for cost-effective, lightweight solutions in industrial applications.
U.S. Exoskeleton Market Share, By End-User Mode, 2025, (%)
| Segments | Shares (%) |
| Lower Body | 42% |
| Upper Body | 30% |
| Full Body | 28% |
- Lower Body: The highest of the 42% market share is acquired by the lower body, driven by high demand for rehabilitation and mobility assistance for lower limb disabilities.
- Upper Body: The upper body segment is growing at the fastest rate, holding 30% because of increasing demand for ergonomic support and injury prevention in industrial settings.
- Full Body: The full body segment holds 28% due to high costs, complexity, and limited adoption compared to specialized exoskeletons.
U.S. Exoskeleton Market Share, By End-User Mode, 2025, (%)
| Segments | Shares (%) |
| Healthcare | 49% |
| Industry | 30% |
| Military | 21% |
- Healthcare: the healthcare segment dominates the market with 49% due to increasing cases of mobility impairments, an aging population, and rising use in rehabilitation therapies.
- Industry: the industry segment is growing fastest with 30%, as demand for worker safety, ergonomics, and productivity is increasing.
- Military: the military segment holds the 21% due to limited large-scale deployment and high development costs, despite its strategic importance.
Top Companies in the U.S. Exoskeleton Market
- Ekso Bionics
- Lockheed Martin Corporation
- Suit X
- Rex Bionics Plc.
- ReWalk Robotics
- DIH Medical
- German Bionic
- Sarcos Technology and Robotics Corporation
- Parker Hannifin Corporation
- Bionik Laboratories
Segments Covered in the Report
By Mobility
- Mobile
- Fixed/Stationary
By Technology
- Powered
- Non-powered
By Extremity
- Upper Body
- Lower Body
- Full Body
By End-use
- Healthcare
- Military
- Industry
| Mobility | 2025 | 2026 | 2027 | 2028 | 2029 | 2030 | 2031 | 2032 | 2033 | 2034 | 2035 |
|---|---|---|---|---|---|---|---|---|---|---|---|
| Mobile | 20.69 | 23.42 | 26.51 | 30.01 | 33.97 | 38.45 | 43.53 | 49.28 | 55.78 | 63.14 | 71.48 |
| Fixed/Stationary | 31.03 | 35.13 | 39.77 | 45.01 | 50.96 | 57.68 | 65.30 | 73.92 | 83.67 | 94.72 | 107.22 |
| Technology | 2025 | 2026 | 2027 | 2028 | 2029 | 2030 | 2031 | 2032 | 2033 | 2034 | 2035 |
|---|---|---|---|---|---|---|---|---|---|---|---|
| Powered | 28.45 | 32.20 | 36.45 | 41.26 | 46.71 | 52.88 | 59.85 | 67.76 | 76.70 | 86.82 | 98.28 |
| Non-powered | 23.27 | 26.35 | 29.82 | 33.76 | 38.22 | 43.26 | 48.97 | 55.44 | 62.75 | 71.04 | 80.41 |
Research Methodology
Related Databooks
March 2026
March 2026
March 2026
March 2026

 sales@precedenceresearch.com
 +1 804-441-9344
 Download Databook
 Schedule a Meeting