U.S. Forklift Market Size is USD 12.52 Billion in 2026
U.S. Forklift Market (By Class: Class 1, Class 2, Class 3, Class 4/5; By Power Source: ICE, Electric; By Load Capacity, Below 5 Ton, 5-15 Ton, Above 16 Ton; By Electric Battery Type: Li-ion, Lead Acid; By End-use: Industrial, Logistics, Chemical, Food & Beverage, Retail & E-Commerce, Others) Industry Size, Share, Growth, Trends 2026 to 2035.


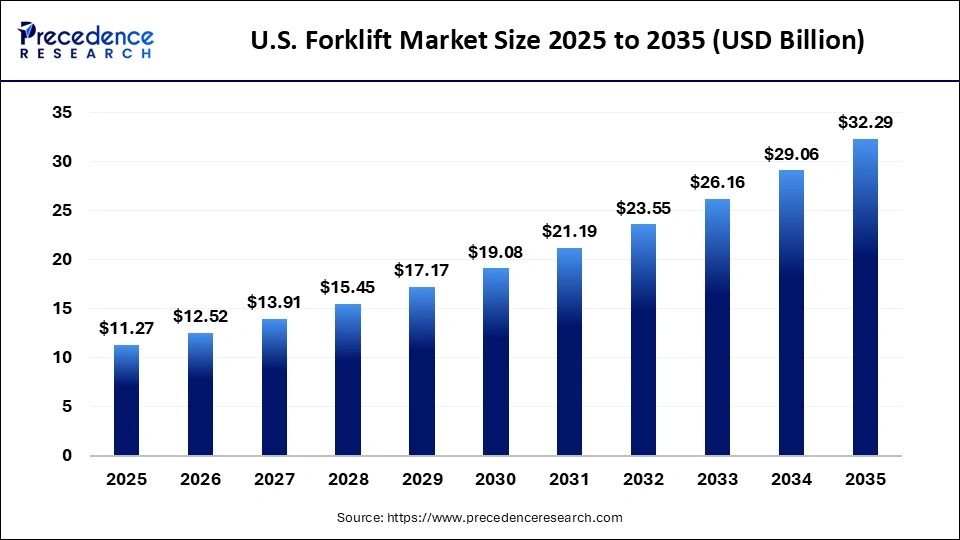
The U.S. forklift market size was estimated at USD 11.27 billion in 2025 and is predicted to increase from USD 12.52 billion in 2026 to approximately USD 32.29 billion by 2035, expanding at a CAGR of 11.10% from 2026 to 2035. Due to e-commerce and warehousing growth, companies adopt electric and automated equipment for efficiency, and technological improvements boost operational productivity, helping material handling fleets meet rising logistics and industrial demands.
U.S. Forklift Market Statical Scope
| Reports Attributes | Statistics |
| Market Size in 2025 | USD 11.27 Billion |
| Market Size in 2026 | USD 12.52 Billion |
| Market Size by 2035 | USD 32.29 Billion |
| CAGR 2026 to 2035 | 11.10% |
| Base Year | 2025 |
| Forecast Period | 2026 to 2035 |
Technological advancements are reshaping the U.S. forklift market by driving greater efficiency, safety, and productivity. Innovations such as lithium-Ion battery automation feature IoT Connectivity and autonomous guidance systems are enabling Four Clips to update with faster charging, real-time monitoring, and reduced downtime. These improvements help warehouses and logistics centers meet rising demand from e-commerce and industrial sectors while lowering operating costs and boosting workplace safety, strengthening overall market growth.
U.S. Forklift Market Share, By Class, 2025 (%)
| Segments | Shares (%) |
| Class 1 | 20% |
| Class 2 | 15% |
| Class 3 | 44% |
| Class 4/5 | 21% |
- Class 1 - The segment accounted for 20% of the total market share, due to the strong uptake of electric forklifts for indoor operations.
- Class 2 - The segment accounted for 15% of the total market share, primarily used in the narrow aisle and specialized warehouse operations, limiting its adoption and broader material handling applications.
- Class 3 - The segment dominated the market with a 44% share, because its electric motorized trucks and pallet jacks are highly suited to material handling and warehouse operations, providing an efficient, compact solution for moving goods across busy indoor facilities.
- Class 4/5 - The segment accounted for 21% of the total market share, as its internal combustion models are preferred for rugged doors and heavy-duty handling tasks, though this doesn't outweigh the larger shares held by more versatile or indoor-focused segments.
U.S. Forklift Market Share, By Power Source, 2025 (%)
| Segments | Shares (%) |
| ICE | 26% |
| Electric | 74% |
- ICE - The segment accounted for 26% of the total market share, due to steady demand for its robust performance and outdoor and heavy-duty material handling tasks.
- Electric - The segment dominated the market with a 74% share, due to its lower operating and maintenance cost, zero emissions, and superior performance in Into Logistics and warehouse environments, making it the preferred choice over traditional internal combustion models.
U.S. Forklift Market Share, By Load Capacity, 2025 (%)
| Segments | Shares (%) |
| Below 5 Ton | 19% |
| 5-15 Ton | 61% |
| Above 16 Ton | 20% |
- Below 5 Ton - The segment accounted for 19% of the total market share, due to being widely favored in warehouse retail and light manufacturing environments where ease of maneuverability, lower costs, and efficient handling of typical Palletized loads make them an unattractive choice.
- 5-15 Ton - The segment dominated the market with a 61% share, due to being widely used for medium to heavy material handling tasks across manufacturing logistics and warehousing, offering a balanced mix of lifting power and versatility that boosts its appeal in diverse industrial operations.
- Above 16 Ton- The segment accounted for 20% of the total market share, due to high capacity. Four clips are essential for handling extremely heavy loads in sectors: ports, steel production, and large-scale industrial facilities. We are robust, lifting power and durability are critical.
U.S. Forklift Market Share, By Electric Battery Type, 2025 (%)
| Segments | Shares (%) |
| Li-ion | 37% |
| Lead Acid | 63% |
- Li-ion - The segment accounted for 37% of the total market share, due to its faster charging times, longer service life, and greater operational efficiency compared with conventional battery technologies, making it especially attractive for high productivity warehouse and logistics operations.
- Lead Acid - The segment dominated the market with a 63% share, because it is cost-effective, reliable, and a widely established power source for forklifts with mature manufacturing and recycling infrastructure that keeps them healthy at the forefront of conventional battery choices.
U.S. Forklift Market Share, By End Use, 2025 (%)
| Segments | Shares (%) |
| Industrial- | 23% |
| Logistics- | 18% |
| Chemical- | 8% |
| Food & Beverage- | 10% |
| Retail & E-Commerce- | 25% |
| Others | 16% |
- Industrial - The segment accounted for 23% of the total market share, due to being used in manufacturing and heavy industrial settings where robust material handling equipment is essential for raw materials, intermediate products, and finished goods to be efficiently moved throughout production and warehousing operations.
- Logistics - The segment accounted for 18% of the total market share, due to streamlining material movement within distribution centres, transportation hubs, and supply chains, helping companies handle inventory efficiently, reduce transit times, and support expanding e-commerce operations.
- Chemical - The segment accounted for 8% of the total market share, as specialized material handling equipment is needed to safely manage hazardous substances and comply with strict safety and regulatory requirements in chemical plants, which limit but still sustain demand in the industry.
- Food & Beverage - The segment accounted for 10% of the total market share, due to efficiently handling perishable goods, packaging materials, and pellets in temperature-controlled warehouses, ensuring smooth operations while maintaining product quality and safety standards.
- Retail & E-Commerce - The segment dominated the market with a 25% share, due to the rapid expansion of online shopping and related logistics, which has increased demand for efficient materials handling equipment in fulfillment centers and distribution hubs to support faster order processing and inventory turnover.
- Others - Includes various additional conditions, with a 16% share, result in moderate contribution.
Top Companies in the U.S. Forklift Market
- HELI AMERICA Inc.
- Clark Equipment Handling Company
- Crown Equipment Corporation
- Doosan Industrial Vehicle America Corporation
- Hangcha Forklift America
- Hyster-Yale Materials Handling, Inc.
- KION North America
- Komatsu Ltd.
- Mitsubishi Logisnext Co., Ltd.
- Toyota Material Handling
Segments Covered in the Report
By Class
- Class 1
- Class 2
- Class 3
- Class 4/5
By Power Source
- ICE
- Electric
By Load Capacity
- Below 5 Ton
- 5-15 Ton
- Above 16 Ton
By Electric Battery Type
- Li-ion
- Lead Acid
By End-use
- Industrial
- Logistics
- Chemical
- Food & Beverage
- Retail & E-Commerce
- Others
| Class | 2025 | 2026 | 2027 | 2028 | 2029 | 2030 | 2031 | 2032 | 2033 | 2034 | 2035 |
|---|---|---|---|---|---|---|---|---|---|---|---|
| Class 1 | 3.94 | 4.41 | 4.92 | 5.50 | 6.15 | 6.87 | 7.67 | 8.57 | 9.57 | 10.69 | 11.95 |
| Class 2 | 2.82 | 3.12 | 3.45 | 3.82 | 4.22 | 4.67 | 5.17 | 5.72 | 6.33 | 7.00 | 7.75 |
| Class 3 | 2.25 | 2.50 | 2.78 | 3.09 | 3.43 | 3.82 | 4.24 | 4.71 | 5.23 | 5.81 | 6.46 |
| Class 4/5 | 2.25 | 2.49 | 2.75 | 3.04 | 3.37 | 3.72 | 4.11 | 4.55 | 5.02 | 5.55 | 6.14 |
| Power Source | 2025 | 2026 | 2027 | 2028 | 2029 | 2030 | 2031 | 2032 | 2033 | 2034 | 2035 |
|---|---|---|---|---|---|---|---|---|---|---|---|
| ICE | 5.07 | 5.51 | 5.98 | 6.49 | 7.04 | 7.63 | 8.26 | 8.95 | 9.68 | 10.46 | 11.30 |
| Electric | 6.20 | 7.01 | 7.93 | 8.96 | 10.13 | 11.45 | 12.93 | 14.60 | 16.48 | 18.60 | 20.99 |
Research Methodology
Related Databooks
April 2026
April 2026
April 2026
May 2026

 sales@precedenceresearch.com
 +1 804-441-9344
 Download Databook
 Schedule a Meeting