U.S. Pharmaceutical Market Size is USD 708.28 Billion in 2026
U.S. Pharmaceutical Market (By Molecule Type: Biologics & Biosimilars (Large Molecules), Conventional Drugs (Small Molecules); By Product: Branded, Generic; By Type: Prescription, OTC; By Disease: Cardiovascular diseases, Cancer, Diabetes, Infectious diseases, Neurological disorders, Respiratory diseases, Autoimmune diseases, Mental health disorders, Gastrointestinal disorders, Women’s Health Diseases, Genetic and Rare genetic diseases, Dermatological conditions, Obesity, Renal diseases, Liver conditions, Hematological disorders, Eye conditions, Infertility conditions, Endocrine disorders, Allergies, Others; By Route of Administration: Oral, Topical, Parenteral, Inhalations, Other; By Age Group: Children & Adolescents, Adults, Geriatric; By Distribution Channel Group: Hospital Pharmacy, Retail Pharmacy, Others) Industry Size, Share, Growth, Trends 2026 to 2035.


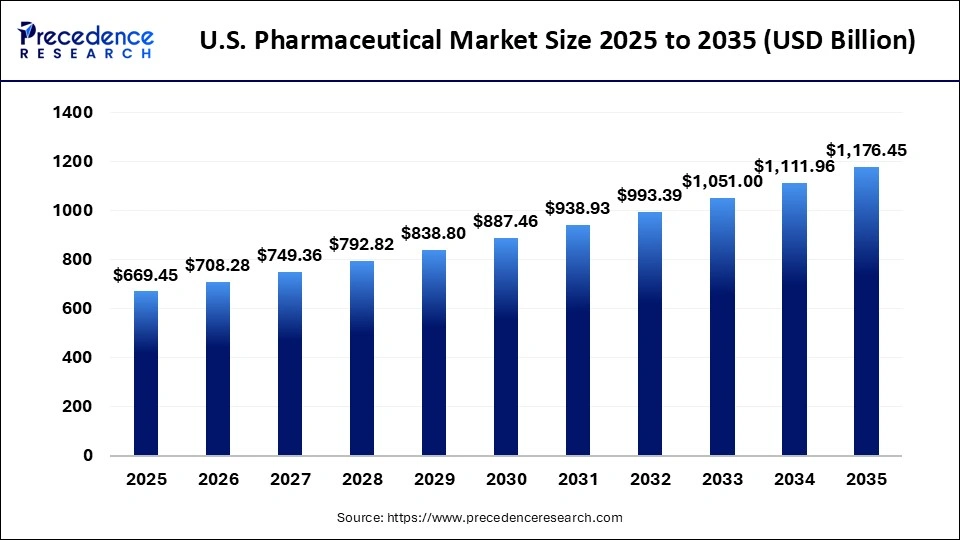
The U.S. pharmaceutical market size was estimated at USD 669.45 billion in 2025 and is predicted to increase from USD 708.28 billion in 2026 to approximately USD 1,176.45 billion by 2035, expanding at a CAGR of 5.80% from 2026 to 2035. Largely fueled by the increasing number of ground diseases cases, the growing elderly population, higher government healthcare spending, and Concerted Initiatives aimed at making medications more affordable and widely accessible.
U.S. Pharmaceutical Market Statical Scope
| Reports Attributes | Statistics |
| Market Size in 2025 | USD 669.45 Billion |
| Market Size in 2026 | USD 708.28 Billion |
| Market Size by 2035 | USD 1,176.45 Billion |
| CAGR 2026 to 2035 | 5.80% |
| Base Year | 2025 |
| Forecast Period | 2026 to 2035 |
The U.S. pharmaceutical industry has experienced remarkable growth driven by advances in therapeutics, a robust product development pipeline, and innovations in targeted therapies. Biologic and personalized medicine are reshaping treatment strategies, offering more effective solutions for complex conditions such as cancer, autoimmune disorders, and genetic diseases. Decent FDA-approved breakthroughs, including gene therapies and RNA-based treatments for inherited tincal disorders and certain cancers, are fueling this expansion.
The introduction of cutting-edge therapies like CAR-T cell treatments for specific cancers highlights the market focus on preventive medicines and the potential to address previously untreatable conditions. Additionally, ongoing progress in immune oncology is transforming cancer care. Marking is a significant milestone in therapeutic development.
The pharmaceutical industry focuses on discovering, developing, manufacturing, and distributing medicines that help prevent, treat, or alleviate these symptoms of diseases and injuries for patients.
U.S. Pharmaceutical Market Share, By Molecule Type, 2025 (%)
| Segments | Shares (%) |
| Biologics & Biosimilars (Large Molecules) | 45% |
| Conventional Drugs (Small Molecules) | 55% |
- Biologics & Biosimilars (Large Molecules) - The segment accounted for 45% of the total market share, due to increasing demand for targeted therapies and advanced treatment options.
- Conventional Drugs (Small Molecules) - The segment dominated the market with a 55% share, fueled by its well-established efficiency, lower cost, and widespread availability.
U.S. Pharmaceutical Market Share, By Product, 2025 (%)
| Segments | Shares (%) |
| Branded | 67% |
| Generic | 33% |
- Branded - The segment dominated the market with a 67% share, due to strong consumer trust, patent protections, and continuous innovation in drug formulations.
- Generic - The segment accounted for 33% of the total market share, due to rising demand for cost-effective alternatives and increasing adoption by health care providers and patients.
U.S. Pharmaceutical Market Share, By Type, 2025 (%)
| Segments | Shares (%) |
| Prescription | 87% |
| OTC | 13% |
- Prescription - The segment dominated the market with an 87% share, due to the increasing prevalence of chronic diseases and the growing reliance on physician-prescribed therapies.
- OTC - The segment accounted for 13% of the total market share, due to rising consumer awareness of self-medication trends and increasing demand for convenient, accessible health products.
U.S. Pharmaceutical Market Share, By Disease, 2025 (%)
| Segments | Shares (%) |
| Cardiovascular diseases | 22% |
| Cancer | 15% |
| Diabetes | 13% |
| Infectious diseases | 8% |
| Neurological disorders | 9% |
| Respiratory diseases | 8% |
| Autoimmune diseases | 7% |
| Mental health disorders | 4% |
| Gastrointestinal disorders | 4% |
| Women's Health Diseases | 3% |
| Genetic and Rare genetic diseases | 3% |
| Dermatological conditions | 2% |
| Obesity | 2% |
- Cardiovascular diseases- The segment accounted for 22% of the total market share, due to the rising prevalence of heart-related conditions and the continuous development of innovative therapies to manage cardiovascular health.
- Cancer- The segment dominated the market with an 15% share, fueled by increasing cancer prevalence, advancements in targeted therapies, and rising investments in Oncology Research and treatment options.
- Diabetes- The segment accounted for 13% of the total market share, due to the rising prevalence of diabetes, growing awareness about disease management, and increased demand for innovative anti-diabetic medications.
- Infectious diseases- The segment accounted for 8% of the total market share, due to the ongoing need for vacancies, rising prevalence of infection, and growing investment in antimicrobial and antiviral therapies.
- Neurological disorders- The segment accounted for 9% of the total market share, due to the increasing prevalence of neurodegenerative and mental health conditions, along with rising demand for advanced therapy and innovative treatment options.
- Respiratory diseases- The segment accounted for 8% of the total market share, due to the rising prevalence of respiratory conditions, increasing air pollution, and growing demand for innovative inhalation therapies and treatments.
- Autoimmune diseases- The segment accounted for 7% of the total market share, driven by the rise in incidents of autoimmune disorders, growing awareness of treatment options, and increasing adoption of biologic and targeted therapies.
- Mental health disorders- The segment accounted for 4% of the total market share, due to increasing awareness of mental health issues, raising problems with conditions such as depression and anxiety, and growing adoption of innovative psychiatric treatments.
- Gastrointestinal disorders- The segment accounted for 4% of the total market share, driven by the increasing prevalence of digestive conditions, rising awareness of gut health, and growing demand for advanced treatments and therapies.
- Women's Health Diseases- The segment accounted for 3% of the total market share, due to rising awareness of women's specific health issues, increased demand for specialized therapies, and growing focus on preventive and reproductive healthcare.
- Genetic and Rare genetic diseases- The segment accounted for 3% of the total market share, due to advancements in gene therapies, increased research funding, and growing awareness and diagnosis of rare genetic conditions.
- Dermatological conditions- The segment accounted for 2% of the total market share, due to rising awareness of skin health, increasing skin disorders, and growing demand for advanced topical and systemic treatments.
- Obesity- The segment accounted for 2% of the total market share, due to increasing obesity, growing awareness of weight management, and rising demand for effective and low obesity therapies.
U.S. Pharmaceutical Market Share, By Route of Administration, 2025 (%)
| Segments | Shares (%) |
| Oral | 58% |
| Topical | 10% |
| Parenteral | 13% |
| Inhalations | 7% |
| Others | 12% |
- Oral - The segment dominated the market with a 58% share, due to its ease of administration, high patient compliance, and widespread ability across health care settings.
- Topical - The segment accounted for 10% of the total market share, due to increasing demand for localized treatments, rising prevalence of skin conditions, and the convenience of non-invasive therapy options.
- Parenteral - The segment accounted for 13% of the total market share, due to increasing need for injectable therapies, higher efficacy of parental administration, and growing demand for biologic and complex medications.
- Inhalations - The segment accounted for 7% of the total market share, due to the rising number of respiratory diseases, increasing adoption of targeted delivery systems, and growing demand for convenient and effective pulmonary treatments.
- Others - Includes various additional conditions, with a 12% share, result in moderate contribution.
U.S. Pharmaceutical Market Share, By Age Group, 2025 (%)
| Segments | Shares (%) |
| Children & Adolescents | 12% |
| Adults | 63% |
| Geriatric | 25% |
- Children & Adolescents - The segment accounted for 12% of the total market share, due to increasing awareness of pediatric healthcare needs, rising childhood illnesses, and growing demand for age-appropriate formulations and therapies.
- Adults - The segment dominated the market with a 63% share, due to the last flight to the population, prevalence of chronic and lifestyle-related diseases, and growing demand for innovative and prescription therapies.
- Geriatric -The segment accounted for 25% of the total market share, due to an aging population, an increase in chronic diseases among adults, and growing demand for medications tailored to age-related health conditions.
U.S. Pharmaceutical Market Share, By Distribution Channel Group, 2025 (%)
| Segments | Shares (%) |
| Hospital Pharmacy | 54% |
| Retail Pharmacy | 30% |
| Others | 16% |
- Hospital Pharmacy- The segment dominated the market with a 54% share, due to the increasing number of hospitalizations, higher demand for inpatient care medications, and the growing lines in hospitals for complex and specialized treatments.
- Retail Pharmacy- The segment accounted for 30% of the total market share, due to increasing consumption trends for convenient access to medications and the rise in prescription fulfillment services.
- Others - Includes various additional conditions, with a 16% share, result in moderate contribution.
Top Companies in the U.S. Biscuits Market
- F. Hoffmann-La Roche Ltd
- Novartis AG
- AbbVie Inc.
- Johnson & Johnson Services, Inc.
- Merck & Co., Inc.
- Pfizer Inc.
- Bristol-Myers Squibb Company
- Sanofi
- GSK plc.
- Takeda Pharmaceutical Company Limited
Segments Covered in the Report
By Molecule Type
- Biologics & Biosimilars (Large Molecules)
- Conventional Drugs (Small Molecules)
By Product
- Branded
- Generic
By Type
- Prescription
- OTC
By Disease
- Cardiovascular diseases
- Cancer
- Diabetes
- Infectious diseases
- Neurological disorders
- Respiratory diseases
- Autoimmune diseases
- Mental health disorders
- Gastrointestinal disorders
- Women's Health Diseases
- Genetic and Rare genetic diseases
- Dermatological conditions
- Obesity
- Renal diseases
- Liver conditions
- Hematological disorders
- Eye conditions
- Infertility conditions
- Endocrine disorders
- Allergies
- Others
By Route of Administration
- Oral
- Topical
- Parenteral
- Inhalations
- Other
By Age Group
- Children & Adolescents
- Adults
- Geriatric
By Distribution Channel Group
- Hospital Pharmacy
- Retail Pharmacy
- Others
| Molecule Type | 2025 | 2026 | 2027 | 2028 | 2029 | 2030 | 2031 | 2032 | 2033 | 2034 | 2035 |
|---|---|---|---|---|---|---|---|---|---|---|---|
| Biologics & Biosimilars | 281.17 | 301.02 | 322.22 | 344.88 | 369.07 | 394.92 | 422.52 | 451.99 | 483.46 | 517.06 | 552.93 |
| Conventional Drugs | 388.28 | 407.26 | 427.14 | 447.94 | 469.73 | 492.54 | 516.41 | 541.40 | 567.54 | 594.90 | 623.52 |
| Product | 2025 | 2026 | 2027 | 2028 | 2029 | 2030 | 2031 | 2032 | 2033 | 2034 | 2035 |
|---|---|---|---|---|---|---|---|---|---|---|---|
| Branded | 435.14 | 457.55 | 481.09 | 505.82 | 531.80 | 559.10 | 587.77 | 617.89 | 649.52 | 682.74 | 717.63 |
| Generic | 234.31 | 250.73 | 268.27 | 287.00 | 307.00 | 328.36 | 351.16 | 375.50 | 401.48 | 429.22 | 458.82 |
| Type | 2025 | 2026 | 2027 | 2028 | 2029 | 2030 | 2031 | 2032 | 2033 | 2034 | 2035 |
|---|---|---|---|---|---|---|---|---|---|---|---|
| Prescription | 589.12 | 621.87 | 656.44 | 692.92 | 731.43 | 772.09 | 814.99 | 860.28 | 908.06 | 958.51 | 1011.75 |
| OTC | 80.33 | 86.41 | 92.92 | 99.90 | 107.37 | 115.37 | 123.94 | 133.11 | 142.94 | 153.45 | 164.70 |
Research Methodology
Related Databooks
May 2026
May 2026
May 2026
May 2026

 sales@precedenceresearch.com
 +1 804-441-9344
 Download Databook
 Schedule a Meeting