U.S. Tablet Market Size is USD 13.37 Billion in 2026
U.S. Tablet Market (By Product: Hybrid Tab PC, Slate Tab PC, Others: By Operating System: iOS, Android, Windows, Others; By Screen Resolution: 768 × 1024, 800 × 1280, 1280 × 800, 834 × 1112, 962 × 601, Others; By Distribution Channel: Online, Offline) Industry Size, Share, Growth, Trends 2026 to 2035.


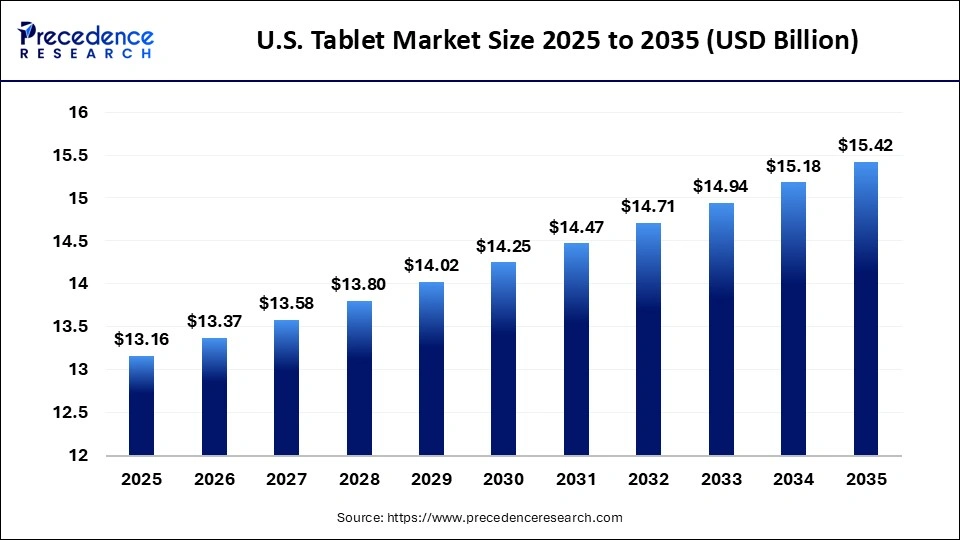
The U.S. tablet market size was estimated at USD 13.16 billion in 2025 and is predicted to increase from USD 13.37 billion in 2026 to approximately USD 15.42 billion by 2035, expanding at a CAGR of 1.60% from 2026 to 2035. AI integration, hybrid work, and educational demand are driving the U.S. tablet market.
U.S. Tablet Market Statical Scope
| Reports Attributes | Statistics |
| Market Size in 2025 | USD 13.16 Billion |
| Market Size in 2026 | USD 13.37 Billion |
| Market Size by 2035 | USD 15.42 Billion |
| CAGR 2026 to 2035 | 1.60% |
| Base Year | 2025 |
| Forecast Period | 2026 to 2035 |
A tablet is defined as a portable electronic device featuring a flat touchscreen interface, operated by a user-friendly operating system. It is composed of components such as processors, cameras, sensors, batteries, audio systems, and random access memory (RAM). Additionally, tablets are equipped with Wi-Fi or cellular connectivity options, enhancing their utility and connectivity.
The U.S. tablet market is characterized by a dynamic interplay between form and function, with vendors offering a diverse range of devices, from lightweight media consumption models to rugged industrial workhorses and hybrid variants that challenge traditional laptops.
The growth of the U.S. tablet market is fueled by the rising consumption of digital content, the expansion of e-commerce platforms , and the integration of tablets with smart home systems. Educational institutions increasingly adopt tablets for interactive learning. The enhanced ecosystem of applications and compatibility with accessories, such as styluses and keyboards, also contributes to the tablet's appeal. Moreover, the affordability of entry-level models promotes broader market accessibility across various demographics.
U.S. Tablet Market Share, By Product, 2025 (%)
| Segments | Shares (%) |
| Hybrid Tab PC | 49% |
| Slate Tab PC | 32% |
| Others | 19% |
- Slate tablet PCs- Slate tablet PCs segment favored for their lightweight, portable, and user-friendly characteristics, account for a 49% share, establishing them as the leading product segment in the U.S. tablet market.
- Hybrid tablet PCs- Hybrid tablet PCs represent a 32% share and are experiencing rapid growth as they meet rising demand for devices that combine productivity and portability.
- Others - Includes niche tablet formats, with a 19% share, result in moderate contribution.
U.S. Tablet Market Share, By Operating System, 2025 (%)
| Segments | Shares (%) |
| iOS | 43% |
| Android | 30% |
| Windows | 20% |
| Others | 7% |
- iOS- iOS leads in the tablet market with a 43% share, attributed to its strong ecosystem integration, premium user experience, and brand loyalty.
- Android- Android segment accounts 30% share and is the fastest-growing operating system segment, driven by wider affordability and increasing performance improvements.
- Windows - Windows, holding a 20% share, is expanding due to the demand for desktop-like functionality and legacy software support, particularly with the adoption of Windows 11 in commercial applications.
- Others - Minor operating systems, with a 5% share, result in limited contribution.
U.S. Tablet Market Share, By Screen Resolution, 2025 (%)
| Segments | Shares (%) |
| 768 × 1024 | 28% |
| 800 × 1280 | 22% |
| 1280 × 800 | 18% |
| 834 × 1112 | 13% |
| 962 × 601 | 9% |
| Others | 10% |
- 768 × 1024 - The 768 × 1024 resolution is widely adopted in standard tablet formats, offering a balanced display quality and cost efficiency, thereby securing a leading position with a 28% share.
- 800 × 1280 - The 800 × 1280 resolution, increasingly sought after for its sharper visuals and enhanced user experience, holds a 22% share and is driving rapid growth within the market.
- 1280 × 800 - This segment accounts for 18% market share. It serves as a balanced option between price and performance and utilized in education and portable consumer.
- 834 × 1112 - Used in premium compact tablets, with a 13% share, supports the market but remains limited.
- 962 × 601 - Niche resolution segment, with a 9% share, restricts broader adoption.
- Others - Diverse screen formats, with a 10% share, result in moderate contribution.
U.S. Tablet Market Share, By Distribution Channel, 2025 (%)
| Segments | Shares (%) |
| Online | 65% |
| Offline | 35% |
- Online- the online segment dominates with 65% share. High consumer preference for convenience, competitive pricing, and wider product availability drives its dominance in the market.
- Offline- the offline segment is growing fastest, holding the 35% share. Continued importance of in-store experience, product trials, and retail assistance supports its faster growth compared to online saturation.
Top Companies in the U.S. Tablet Market
- Apple
- Amazon
- Samsung
- TCL
- Microsoft
- Alcatel
- Motorola
- Asus
- Lenovo
Segments Covered in the Report
By Product
- Hybrid Tab PC
- Slate Tab PC
- Others
By Operating System
- iOS
- Android
- Windows
- Others
By Screen Resolution
- 768 × 1024
- 800 × 1280
- 1280 × 800
- 834 × 1112
- 962 × 601
- Others
By Distribution Channel
- Online
- Offline
| Product | 2025 | 2026 | 2027 | 2028 | 2029 | 2030 | 2031 | 2032 | 2033 | 2034 | 2035 |
|---|---|---|---|---|---|---|---|---|---|---|---|
| Hybrid Tab PC | 3.68 | 3.77 | 3.86 | 3.95 | 4.04 | 4.13 | 4.23 | 4.32 | 4.42 | 4.52 | 4.63 |
| Slate Tab PC | 7.50 | 7.58 | 7.66 | 7.74 | 7.82 | 7.91 | 7.99 | 8.07 | 8.16 | 8.24 | 8.33 |
| Others | 1.97 | 2.02 | 2.06 | 2.11 | 2.16 | 2.21 | 2.26 | 2.31 | 2.36 | 2.41 | 2.47 |
| Operating System | 2025 | 2026 | 2027 | 2028 | 2029 | 2030 | 2031 | 2032 | 2033 | 2034 | 2035 |
|---|---|---|---|---|---|---|---|---|---|---|---|
| iOS | 6.84 | 6.93 | 7.01 | 7.09 | 7.18 | 7.27 | 7.35 | 7.44 | 7.53 | 7.62 | 7.71 |
| Android | 3.95 | 4.04 | 4.13 | 4.22 | 4.32 | 4.42 | 4.52 | 4.62 | 4.72 | 4.83 | 4.94 |
| Windows | 1.58 | 1.62 | 1.66 | 1.70 | 1.74 | 1.78 | 1.82 | 1.87 | 1.91 | 1.96 | 2.01 |
| Others | 0.79 | 0.79 | 0.79 | 0.79 | 0.79 | 0.78 | 0.78 | 0.78 | 0.78 | 0.77 | 0.77 |
Research Methodology
Related Databooks
March 2026
March 2026
March 2026
March 2026

 sales@precedenceresearch.com
 +1 804-441-9344
 Download Databook
 Schedule a Meeting