


Cosmetic Medical Tourism Market Size, Companies, Share, Patient Volume, Treatment Adoption Rates, Pricing Analysis, Regulatory Landscape, Competitive Positioning, and Demand Forecast
The Medical Tourism Market is growing as patients seek affordable treatment, specialist expertise, advanced healthcare, and shorter waiting times abroad. South Korea, Thailand, India, Malaysia, and Türkiye remain key destinations, with cosmetic, dental, and dermatology procedures driving patient volumes, while cardiac, oncology, orthopaedic, and transplant care contribute higher value per case.
Source: https://www.precedenceresearch.com/cosmetic-medical-tourism-market
 Get a Sample
 Table Of Content


What is Cosmetic Medical Tourism Market Size?
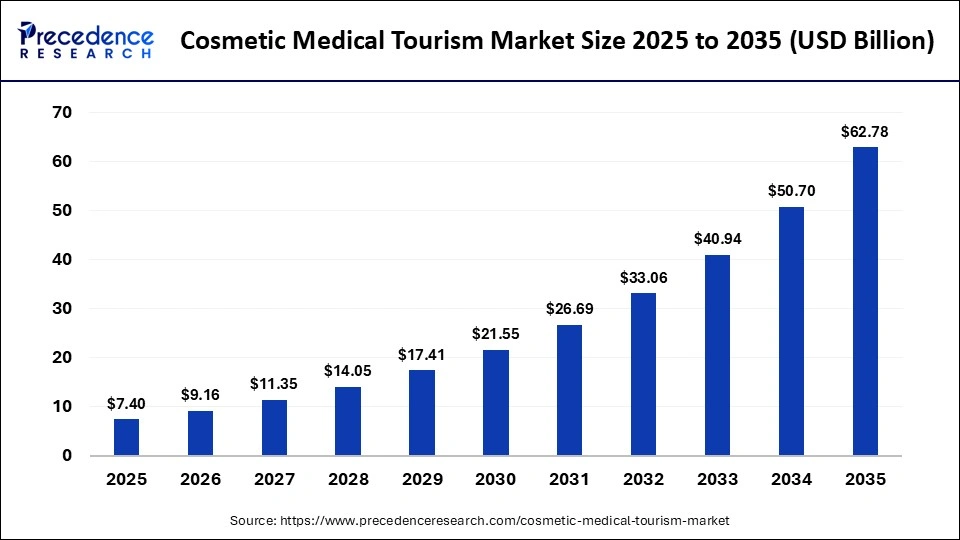
The global cosmetic medical tourism market size is predicted to increase from USD 9.16 billion in 2026 to approximately USD 62.78 billion by 2035, expanding at a CAGR of 23.84% from 2026 to 2035. The cosmetic medical tourism market is experiencing robust growth, driven by the rise in beauty consciousness, cost-efficiency, accessibility & superior quality care. Cosmetic procedures are in high demand, and this market has benefited from well-established advanced technology and bundled travel packages. Technological advancements, such as AI, robotics, and 3D surgical planning, propel market growth in the near future.
Key Takeaways
- The upside case, at 11-12% a year, takes 2035 to spend toward USD 225 billion. The downside case, at about 5.5%, leaves it at USD 135-140 billion.
- South Korea hosted 2.01 million foreign patients in 2025, up about 72% on 2024. They spent KRW 12.5 trillion (about USD 8.4 billion), and only 26% of that paid for medical services.
- Türkiye treated about 1.40 million patients in 2025, roughly 7% fewer than in 2024. Revenue held near USD 3.02 billion, so spend per patient rose from USD 2,007 to USD 2,161.
- India recorded about 507,000 medical-visa arrivals in 2026, around a fifth fewer than in 2024. Bangladesh supplied roughly 64% of them.
- Treatment costs run 40-70% below European levels in Türkiye and 50-70% below Western levels in Thailand. Facilitators charge 20-35% of treatment value, while direct channels cost 8-12% of revenue.
- International patients generate about 67% of revenue at Bumrungrad, 28% at BDMS and 9% at Max Healthcare.
- Deal valuations of 20-30 times EBITDA show how much investors prize international-patient franchises.
Overview - Price Gaps Started the Market, but Speed, Specialist Depth and Access Now Keep it Growing
The figures cover treatment fees plus the travel, lodging and companion costs that come with them. The same trip can therefore look like USD 2,000 of clinical revenue or USD 4,000 of total spend, depending on who does the counting.
Asia Pacific dominates cross-border patient flows, with South Korea, Thailand, India, and Malaysia serving as major medical tourism destinations. Türkiye has also emerged as a key destination for patients from Europe. Cosmetic, dental, and dermatology cases make up most patient counts. Cardiac, oncology, orthopedic and transplant care make up most of the value. Millions of individuals make their own choices on the demand side, yet a few dozen accredited hospital groups control the supply.
Key coverage: current and forecast spend; patient volumes by destination; largest and fastest-growing corridors; maturity by destination; demand drivers and structural shifts.
Market Overview - Strong Patient Inflows Mask Significant Differences in Medical Tourism Revenue and Market Definitions
Destination data explains why headline numbers differ so much. South Korea hosted 2.01 million foreign patients in 2026, up about 72% on 2026, and those patients and their companions spent KRW 12.5 trillion (about USD 8.4 billion). Only KRW 3.3 trillion of that, roughly 26%, went to medical services. Türkiye treated about 1.40 million patients and earned USD 3.02 billion. India recorded about 507,000 medical-visa arrivals.
Key Coverage
- Treatment-only versus total-spend views
- Regional and destination forecasts
- Base, upside and downside scenarios
Segmentation Analysis: Treatment Mix, Patient Origins, and Payer Groups Shape Market Value and Growth
Treatment type is the first cut. In South Korea, dermatology makes up 62.9% of foreign patients and cosmetic surgery another 11.2%. Our analysis suggests dental and cosmetic work together account for well over a third of patient episodes but a much smaller share of revenue. Oncology, cardiac, orthopedic, transplant and fertility care bring bigger tickets and most of the profit.
Source markets count is similar. China sent 30.8% of Korea's patients in 2026 and Japan sent 29.8%, while US patients grew by more than 70% to about 173,000. Bangladesh alone supplied roughly two-thirds of India's medical arrivals. North American and East Asian demand for Korean dermatology is the fastest-growing pool. Low-acuity cosmetic packages sold through intermediaries are the weakest, since tighter licensing is squeezing them.
Key Coverage
- Treatment, provider type, patient origin, payer (self-pay, insurer, employer), accreditation tier and destination
- Share, value and CAGR for each
What is Pulling Patients Across Borders?
Long waits and high costs of domestic treatment plans have raised cross-border demand. India's e-Medical visa covers more than 170 nationalities, and South Korea eased visa rules for certain visitor groups in late 2024. Korea's foreign patient count rose about 72% in 2025 to 2.01 million, and US patients grew more than 70% to roughly 173,000. The shocks show up just as clearly. Türkiye treated about 7% fewer patients in 2025 (roughly 1.40 million, down from 1.51 million) while revenue stayed near USD 3.02 billion, so spend per patient rose from about USD 2,007 to USD 2,161. India's medical-visa arrivals in 2025 came to about 507,000, roughly a fifth below 2024, and Bangladesh alone sent around 64% of them.
Our analysis shows that the push and pull factors are structural, while the disruptions mostly fade in volume terms but leave a lasting change in patient mix. A reputation scare in Türkiye or political turmoil in Bangladesh drives out the lowest-acuity patients first, and the patients who stay have more complex needs and bring more value. We believe the same thing happened in India during FY26, when listed hospital groups still grew international revenue despite lower patient numbers. Fewer patients with higher revenue each is not a sign of weakness, but it does mean headline arrival counts no longer tell us much about market health.
In our view, concentration risk matters most. A destination that leans on one corridor, as India does on Bangladesh, can lose a fifth of its volume in a single year with no change in clinical quality. We believe providers that spread across source markets and move early into complex care will hold up better than those chasing volume, and that destinations with clear licensing and insurance rules will rebuild trust faster after a perception shock. This creates an opening for operators and platforms that offer verified outcomes, complication cover, and follow-up care.
The full report measures each driver and restraint by destination and patient origin, estimates the volume and value impact of recent shocks, and separates temporary disruption from lasting change. It also tests how exposed each major destination is to a single source corridor.
We also deliver the same intelligence as a structured dataset that tracks destination, patient origin, year, treatment category, visa and licensing regime, and major risk events. Analysts can filter by corridor, compare volume and spend per patient across destinations, and test concentration risk directly, which backs up the strategic view in the report.
Which Corridors, Cities and Rules Now Decide Where Medical Travelers Go?
A handful of corridors carry most of the flows like Europe to Türkiye, Bangladesh and Africa to India, China, Japan and the US to Korea, the Gulf to Thailand, and Indonesia to Malaysia. Korea alone drew about 31% of its 2025 foreign patients from China and nearly 30% from Japan. Capacity has followed the traffic.
Korea has roughly 4,100 institutions registered to treat foreign patients, about 62% of them in Seoul, and Türkiye reports more than 1,500 providers spread across over 40 cities. Thailand is even more concentrated, as Bangkok and central Thailand generate around 74% of medical tourism revenue. Rules are tightening alongside. Türkiye now prioritizes authorized centers for international patients, and draft provisions point to compulsory complication insurance. India has added e-AYUSH and attendant visa categories next to its e-Medical visa.
Our analysis shows that these corridors are no longer informal habits. Visa pathways, registered providers, language support and diaspora networks hold them up, which makes it hard for a rival destination to copy fast. Concentration cuts both ways, though. Seoul's dominance of registered institutions and Bangkok's share of Thai revenue mean one city's capacity, pricing or reputation can set the tone for a whole country. We also read the Turkish insurance proposals as a sign that regulators now treat complications abroad as a system-level problem, not one patient's risk.
Accreditation is changing roles, too. It began as a marketing badge, and now employers, insurers and cautious patients use it as a filter before they shortlist to a hospital. We expect that to widen the gap between accredited groups and the unlicensed tail of clinics, even when headline patient counts dip as regulators clear that tail out.
For providers, the practical result is that compliance and infrastructure can defend a corridor, where price cannot. Operators that meet insurance, licensing and accreditation rules early will likely gain share when rules tighten, while intermediary-led models face rising costs. Policymakers must weigh volume growth against patient protection, and the destinations that settle that trade-off first will earn the more durable trust.
The full report compares corridor volumes, institution counts and accreditation levels of destination by destination, along with the visa, licensing and insurance rules that shape each market. It also assesses corridor-level concentration to show where one source market or one city carries outsized risk.
We can deliver much of this as a structured dataset as well, organized by destination, city, institution, accreditation status, patient origin, year, visa category, and regulatory requirement. Users can filter for accredited providers in each city, compare corridor shares across destinations, or track how rule changes line up with shifts in patient volumes, which gives the report narrative a searchable evidence base.
Who Captures Value in the Medical Travel Chain and is the Facilitator's Grip on the Patient Weakening?
A medical trip moves through four stages, beginning with a home-market referral or facilitator, followed by the treating hospital and its international office, travel and hospitality services, and finally aftercare. Hospitals keep most of the profit. International patients make up anything from under 10% to about two-thirds of revenue at listed Asian hospital groups, and they generally earn better margins than domestic patients. Facilitators hold the access, and they typically charge 2035% of treatment value. Direct acquisition models in the same markets cost closer to 8-12% of revenue.
Our analysis shows that the facilitator's position is riskier than it looks. Owning the patient relationship pays off only while hospitals have no other way to reach patients, and the commission gap is big enough that every hospital with scale has a strong reason to build its own channel. We believe this spread will reshape value-chain economics more than any other force, because it moves margin from intermediary to provider without changing the treatment price. The wide range of international revenue mix points to another divide. Groups near the top of that range build their business around foreign patients, with dedicated international offices and multilingual teams, while groups near the bottom treat them as a handy add-on.
Aftercare is where the chain is weakest. Patients fly home within days, and the hospital that treats them often has low visibility or responsibility after they leave. We believe this gap explains much of the trust problem that keeps coming up in destination markets, and few players contest it. Whoever builds dependable follow-up, remote monitoring and complication cover can win a position that neither facilitators nor hospitals hold today. The strongest candidates are hospital groups that extend downstream and digital platforms that link treatment abroad with a local clinician at home.
The full report assigns cost and margin to each stage of the chain, models facilitator economics against direct channels, maps channel mix by destination and patient origin, and identifies the bottlenecks that limit capacity and patient experience.
Which Types of Operators are Winning the Medical Travel Market?
Fragmentation is mainly at the facilitator and clinic layer. At the hospital level, a small set of groups have built international patients into a distinct business line. IHH Healthcare reported revenue of RM 25.7 billion in 2025 across more than 80 hospitals in ten countries. Bumrungrad earned THB 6.58 billion in the third quarter of 2025, with international patients at a record of 67% of revenue. BDMS booked total operating income of THB 55.6 billion in the first half of 2025, and its international revenue grew 9%, helped by Qatar. International patients brought in 28% of BDMS hospital revenue in 2025, against roughly 9% at Max Healthcare in FY25. Aster put its pre-pandemic share of Indian hospital business at about 15%.
The ratios say more than the revenue totals. A group that earns two-thirds of its income from foreign patients runs a different operation from one that earns under a tenth. The first has dedicated international offices, multilingual clinical teams, direct ties to Gulf and ASEAN referrers, and a pricing model built on self-pay. We think bed count and group revenue are weak guides to who really compete for medical travelers. Bumrungrad is far smaller than IHH or BDMS on revenue, yet its mix makes it the clearest premium international specialist in the set. We also see the field splitting into four types including regional scale groups, single-campus premium hospitals, academic centers in Korea and India with deep transplant and oncology programs, and aesthetic specialists built around volume procedures.
The takeaway for positioning is fairly direct. Scale groups can fund new capacity and acquisitions, and their international share has room to grow as they extend corridors beyond home markets. Premium single-campus operators rely on a few source markets and are vulnerable when demand from key markets weakens, as Bumrungrad's changing patient volumes from China and the Middle East in 2025 demonstrated. Indian chains still have the most headroom, since a 9% international mix leaves a long runway if they can win complex tertiary cases. Operators in the middle, with neither scale nor a sharp specialty, look the hardest to defend.
The full report ranks 22 companies by international revenue, share of revenue from foreign patients and recent growth, then benchmarks their capacity, specialty depth, patient-origin spread and channel strength. It also separates reported figures from estimates and shows how each operator's position has moved since 2026.
We can also deliver company-level intelligence as a structured dataset covering company, destination, year, total revenue, international revenue share, bed capacity, accreditation and source-market mix. Users can filter by country or specialty, compare operators on international exposure, and track shifts over time, which adds a searchable layer to the report's competitive assessment.
Tentative Leading Company Universe
| Company | HQ | Market Position | Core Strength | Major Segments |
| Bumrungrad International Hospital | Bangkok | Premium international leader | Gulf, ASEAN flows | Cardiac, oncology, executive health |
| Bangkok Dusit Medical Services | Bangkok | Thai scale leader | Network breadth | Multispecialty, Middle East |
| Vejthani Hospital | Bangkok | Value specialist | Price competitiveness | Transplant, orthopaedics |
| Yanhee International Hospital | Bangkok | Aesthetic specialist | Procedure volume | Cosmetic surgery |
| IHH Healthcare | Kuala Lumpur | Regional scale leader | Multi-country network | Singapore, Malaysia, Türkiye, India |
| Apollo Hospitals | Chennai | Indian scale leader | Quaternary care | Cardiac, transplant, oncology |
| Max Healthcare | New Delhi | Premium Indian leader | Complex tertiary care | Oncology, neuro, robotics |
| Fortis Healthcare | Gurugram | National network | Specialty clusters | Cardiac, orthopaedics |
| Medanta | Gurugram | Tertiary specialist | Transplant programmes | Liver, cardiac, oncology |
| Aster DM Healthcare | Bengaluru / Dubai | Cross-region operator | India-GCC linkage | Multispecialty |
| Manipal Hospitals | Bengaluru | Network challenger | Footprint, pricing | Multispecialty |
| Medicana | Istanbul | Turkish group leader | Package model | Orthopaedics, oncology, IVF |
| Memorial Healthcare Group | Istanbul | Turkish premium group | Oncology, international desks | Oncology, cardiac |
| Liv Hospital | Istanbul | Premium challenger | Patient experience | Aesthetic, bariatric |
| Asan Medical Center | Seoul | Academic leader | Transplant, oncology | Complex surgery |
| Samsung Medical Center | Seoul | Academic leader | Cancer, imaging | Oncology |
| ID Hospital | Seoul | Aesthetic specialist | Facial contouring | Cosmetic surgery |
| KPJ Healthcare | Johor Bahru | Regional specialist | Malaysian reach | Indonesian patients |
| Cleveland Clinic Abu Dhabi | Abu Dhabi | Gulf quaternary hub | Global clinical brand | Cardiac, neuro |
| Burjeel Holdings | Abu Dhabi | Regional challenger | Gulf network | Oncology, surgery |
| Hospital Angeles | Mexico City | Americas leader | US border demand | Bariatric, orthopaedics |
| Healthtrip | New Delhi | Facilitation platform | Digital intake | India patient routing |
Which Competitive Capabilities and Cross-Border Investments are Redefining Leadership in Medical Tourism?
Competitive advantages are increasingly determined by more than the hospital scale. Our assessment indicates that international revenue mix, accredited bed capacity, specialty depth, physician credentials, patient-origin diversity, channel control, technology adoption and aftercare capabilities are becoming the more relevant measures of medical-tourism strength. Indian tertiary chains and Korean academic centers are particularly positioned in complex oncology and transplant procedures, while Bangkok operators have built stronger Gulf-patient flows. Aesthetics remains more fragmented, with Korean and Thai specialists competing on clinical expertise and istanbul-based groups differentiating through packaged-care models. Capacity expansion is also becoming a strategic signal, including Bumrungrad's THB 4.3 billion Phuket hospital project initiated in February 2025, while two KPJ hospitals joined the Mayo Clinic Care Network in 2026.
Channel economics reinforces this differentiation. Hospitals dependent on facilitators can surrender 2035% of treatment value, compared with approximately 8–12% of revenue for more direct patient-acquisition models. Our analysis indicates that this gap can materially influence profitability even where clinical pricing is broadly competitive. In our view, the strongest operators are estimated to be those that combine clinical complexity and international brand credibility with direct patient acquisition, geographic reach, and controlled referral channels. The full report benchmarks the market across portfolio breadth, technology, application fit, geography, capacity and customer reach, using Leader, Strong, Moderate and Emerging positioning bands.
Capital deployment is reinforcing this competitive shift. IHH's RM 4.2 billion acquisition of island Hospital, followed by its acquisition of Türkiye's Bayındır group, demonstrates the increasing value placed on established cross-border patient franchises. The Aster DMQuality Care India transaction, valued at approximately USD 5 billion, also highlights the scale of consolidation underway; hospital investment in India reached about USD 6 billion in 2024, up 24% year on year. Deal valuations of roughly 2030× EBITDA suggest that investors are assigning a premium to platforms with international-patient access, specialty depth and scalable networks. Our assessment is that consolidation is moving beyond domestic hospital-chain expansion toward cross-border platforms linking clinical capacity, referral channels and international demand pools. The report tracks recent announcements, transaction values, targets, strategic rationale and emerging consolidation patterns across Gulf, Turkish, Indian and Korean healthcare platforms.
The same intelligence can be structured into a competitive benchmarking and transaction database, enabling users to filter companies by international revenue exposure, bed capacity, specialty capabilities, technology adoption, geography, patient channels, acquisition history, deal value, EBITDA multiple and strategic rationale. This dataset complements the strategic analysis by allowing company-level benchmarking, transaction comparisons, and identification of emerging acquisition or expansion targets.
Which Healthcare Providers are Best Positioned to Capture International Medical-Tourism Growth Through?
The competitive landscape is increasingly separating into distinct strategic positions rather than a single hierarchy based on hospital size. The report profiles 22 companies across ownership, financial performance, international revenue mix, service-line breadth, capacity, patient origin, innovation and strategic activity. Our analysis indicates that scale remains a major advantage for networks such as IHH, BDMS and Apollo, but premium international positioning, specialist depth, academic capabilities and targeted geographic expansion are becoming equally important differentiators.
Our assessment is that the strongest 2030 positioning will depend on how effectively each group converts its existing capabilities into international patient volume, higher-value procedures, and scalable cross-border platforms. Premium international leaders such as Bumrungrad and Cleveland Clinic Abu Dhabi are differentiated by brand, complex-care capabilities and international patient appeal, while Max, Medanta and Aster DM have stronger growth potential through capacity expansion and increasing international reach. Asan and Samsung benefit from academic and technology-led differentiation, whereas Yanhee, ID Hospital and Liv compete through focused application expertise. Regional challengers including KPJ, Burjeel, Hospital Angeles and Healthtrip create additional competitive pressure through localized networks and targeted market access.
In our view, the key strategic question is not simply which companies are largest today, but which business models can sustain international growth while improving specialty depth, patient acquisition, capacity utilization and geographic reach. The full report therefore provides company-level benchmarking of financials, international exposure, service portfolio, beds and capacity, patient-origin mix, technology and innovation, expansion activity and strategic positioning, enabling a forward-looking assessment of likely winners through.
Where are the Most Underdeveloped Revenue Pools in Medical Tourism Beyond the Clinical Procedure?
The greatest growth opportunity lies in services and solutions that extend beyond the treatment itself. Korea highlights the scale of this gap, with 74% of spending by foreign patients and their companions going to non-medical providers. This creates significant opportunities in recovery accommodation, wellness, local transport, companion services, and post-treatment support.
Our analysis indicates that this reflects a broader structural issue in medical tourism, where hospitals capture the clinical episode while adjacent stages of the patient journey remain fragmented. From our assessment, these underserved touchpoints represent potential opportunities to build higher-value, integrated patient journeys rather than competing solely for additional procedures.
The analysis further suggests that corporate-sponsored medical travel, remote aftercare, returning Gulf demand in Thailand and India's expansion into high-acuity care are additional areas of white space. These opportunities vary in maturity and commercial potential. Corporate contracts could create more predictable patient volumes, while remote aftercare can extend provider relationships beyond the destination. India's growing capabilities in complex care could also attract higher-value international cases. In our view, the strategic implication is a shift from treating medical tourism as a one-time hospital visit toward managing a broader pre-treatment, treatment, recovery, and follow-up ecosystem.
Türkiye illustrates why upgrading the value captured per patient may be more important than simply increasing volumes. Approximately 1.4 million international patients generated around USD 3 billion, yet stated ambitions imply substantially larger revenue potential. Our assessment is that the gap points toward opportunities in case complexity, premium services, bundled care, aftercare and ancillary spending rather than volume growth alone. The full report quantifies these white-space opportunities by market and application, assessing patient volumes, spending pools, service gaps, corporate demand, aftercare models and opportunities to increase revenue per international patient.
Which Business Models are Best Positioned to Capture Medical-Tourism Growth Through 2035?
Our analysis indicates that the range reflects meaningful sensitivity to international patient flows, healthcare capacity, pricing, investment, and geopolitical or economic conditions. Pricing is also likely to diverge by service type, with greater pricing power in complex, high-acuity care and more limited increases in commoditized aesthetics.
Our assessment is that competitive advantage will come from combining accredited clinical capacity, direct international-patient acquisition and credible aftercare, rather than relying on any single capability. Groups able to control more stages of the patient journey can potentially improve patient retention, reduce intermediary leakage, and capture a greater share of ancillary spending. In our view, this makes capacity expansion, channel ownership, specialty depth and integrated recovery services important determinants of long-term market positioning.
The strategic implication is that future competition will increasingly be about ownership of the patient's relationship, not simply ownership of hospital beds. The full report develops base, upside and downside scenarios through 2035, evaluates expected shifts in pricing, capacity, M&A and market share, and identifies the leading groups, emerging challengers and major profit pools likely to shape the next phase of medical-tourism competition.
Key Strategic Questions Addressed
- How large is global medical tourism on a treatment-only basis versus a total-spend basis, and how fast will each grow to 2035?
- Which treatment categories and corridors create the most value per patient?
- How much of the market is aesthetics and dental, and how exposed is it to regulatory tightening?
- Why did Türkiye's patient numbers fall in 2025 while revenue held, and is that a durable trend?
- How does the shift of Indian volumes toward complex care change growth and margins?
- How are Gulf, Chinese and US patients redistributing across Thailand, Korea, India and Malaysia?
- Which price discounts survive once aftercare, travel and complication risk are included?
- What share of revenue do leading hospital groups derive from international patients, and who is gaining or losing share?
- Which operators combine accreditation, specialty depth and direct channels?
- How dependent are hospitals on facilitators, and what does move to direct acquisition do to margins?
Cosmetic Medical Tourism Market Segments
By Treatment Type
- Cosmetic & Dermatology
- Dental
- Cardiovascular
- Oncology
- Orthopaedic & Spine
- Fertility & IVF
- Bariatric & Weight Management
- Organ Transplant
- Other Treatments
By Care Complexity
- Elective / Low-Acuity
- High-Acuity Tertiary & Quaternary
By Service Provider
- Private Multispecialty Hospitals
- Specialty & Aesthetic Clinics
- Public / Academic Medical Centres
By Payer
- Self-Pay
- Insurer-Funded
- Employer-Sponsored
By Booking Channel
- Direct-to-Hospital
- Facilitators & Agencies
- Digital Platforms
By Destination
- South Korea
- Thailand
- India
- Malaysia
- Türkiye
- United Arab Emirates
- Mexico
- Other Destinations
By Region
- Asia Pacific
- Europe
- Middle East
- North America & Latin America
- Africa
For inquiries regarding discounts, bulk purchases, or customization requests, please contact us at sales@precedenceresearch.com
Frequently Asked Questions





Ask For Sample
No cookie-cutter, only authentic analysis – take the 1st step to become a Precedence Research client
 Get a Sample




 sales@precedenceresearch.com
 Schedule a Meeting