In-Space Manufacturing Service Market Size is USD 4,074.50 Million in 2026
In-space manufacturing service market (By Type: Space-for-Space Manufacturing Service, Space-for-Earth Manufacturing Service, Space-for-Surface Manufacturing Service; By Application: Semiconductors, Pharmaceuticals, Nanomaterials, Life Sciences, 3D Manufacturing, Others; By Region: North America, Europe, Asia-Pacific, Latin America, Middle East & Africa) Industry Size, Share, Growth, Trends 2026 to 2035.


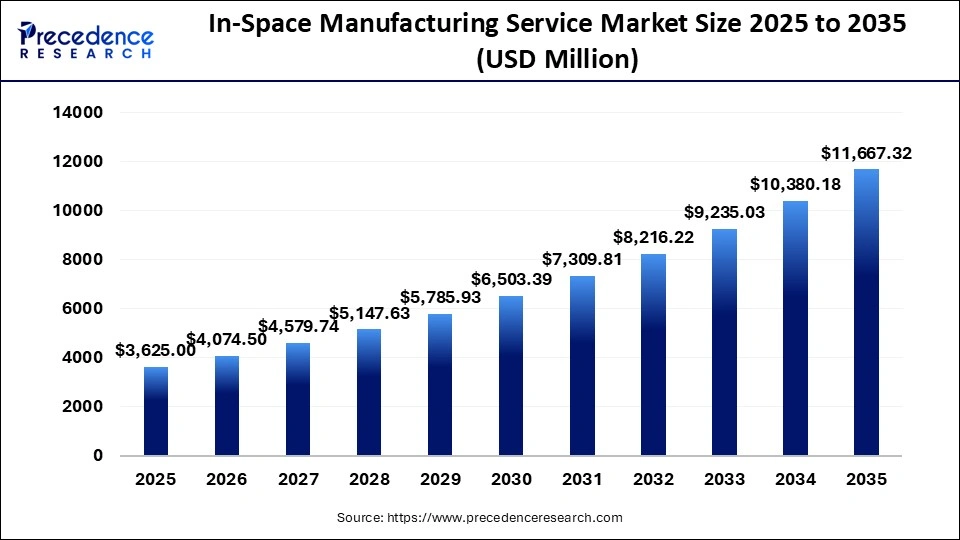
The in-space manufacturing service market size was estimated at USD 3,625.00 million in 2025 and is predicted to increase from USD 4,074.50 million in 2026 to approximately USD 11,667.32 million by 2035, expanding at A CAGR of 12.4% from 2026 to 2035. The in-space manufacturing service market is mainly fueled by the commercialization of Low Earth Orbit (LEO), increasing need for satellite repair and assembly in orbit, and the quest for better material production in microgravity, including high-purity crystals and fiber optics.
In-Space Manufacturing Service Market Statical Scope
| Reports Attributes | Statistics |
| Market Size in 2025 | USD 3,625.00 Million |
| Market Size in 2026 | USD 4,074.50 Million |
| Market Size by 2035 | USD 11,667.32 Million |
| CAGR 2026 to 2035 | 12.4% |
| Base Year | 2025 |
| Forecast Period | 2026 to 2035 |
In-Space Manufacturing (ISM) services create, repair, or assemble materials and structures in orbit, eliminating the need to transport them from Earth. Leveraging microgravity and vacuum conditions, ISM, part of In-Space Servicing, Assembly, and Manufacturing (ISAM), enhances material quality, enabling the efficient construction of large structures.
This environment allows for the production of high-purity materials like protein crystals and advanced semiconductors, which are challenging to produce on Earth. ISM also extends the lifespan of satellites and spacecraft through in-orbit refueling, repairs, and upgrades, reducing the necessity for new launches.
Additionally, it utilizes space resources, such as lunar regolith, for tool and material production. The key advantages of ISM include lower launch costs, reduced material waste, support for sustainable space exploration, and the creation of superior products. ISM is essential for producing high-value materials, including pharmaceuticals and fiber optics , in microgravity, facilitating sustainable exploration through in-situ repairs and on-demand manufacturing.
The microgravity setting improves composite mixing and material purity, while using local resources or recycling debris significantly cuts launch payload costs and enables rapid repairs and assembly in space.
In-space manufacturing, servicing, and assembly allow for the development of larger and more intricate structures in orbit, making it easier to build advanced satellites and infrastructure. This method also enables the creation of specialized medicines and aids in the production of high-tech materials. The In-Space Manufacturing Service market is vital for sustainable space exploration, as it decreases the need for Earth logistics by allowing on-orbit repairs and the creation of valuable materials in microgravity, which helps lower launch expenses.
By producing components in space, particularly through 3D printing, logistics costs and weight limitations from Earth are reduced. Autonomous robots are being increasingly utilized for satellite repair and refueling, which helps minimize orbital debris and promotes sustainability. The unique microgravity setting allows for the production of superior products that are challenging to create on Earth.
The in-space manufacturing service market also aids in the construction of large structures, such as telescopes and solar arrays, that cannot be launched as a whole. Advancing in-situ resource
utilization for building habitats on the Moon or Mars is essential for a long-term human presence in space, reducing reliance on Earth resupply. The industry is transitioning from scientific research to commercial manufacturing.
In-Space Manufacturing Service Market Share, By Region, 2025 (%)
| Regions | Shares (%) |
| North America | 38% |
| Europe | 25% |
| Asia Pacific | 22% |
| Latin America | 8% |
| Middle East & Africa | 7% |
In-Space Manufacturing Service Market Share, By Type, 2025 (%)
| Segments | Shares (%) |
| Space-for-Space Manufacturing Service | 30.00% |
| Space-for-Earth Manufacturing Service | 50.00% |
| Space-for-Surface Manufacturing Service | 20.00% |
- Space-for-Earth Manufacturing Service – It leads demand for producing goods for terrestrial use and, with a 50.0% share, benefits from strong commercial applications and return-on-investment potential.
- Space-for-Space Manufacturing Service – It supports in-orbit infrastructure and, with a 30.0% share, is limited by niche applications and evolving demand.
- Space-for-Surface Manufacturing Service – It focuses on extraterrestrial surface production and, with a 20.0% share, remains constrained by early-stage development and high costs.
In-Space Manufacturing Service Market Share, By Application, 2025 (%)
| Segments | Shares (%) |
| Semiconductors | 22% |
| Pharmaceuticals | 18% |
| Nanomaterials | 15% |
| Life Sciences | 17% |
| 3D Manufacturing | 20% |
| Others | 8% |
- Semiconductors – It leads applications in precision manufacturing and, with a 22.0% share, benefits from high demand for defect-free materials in space conditions.
- Pharmaceuticals – It is expanding research in microgravity and, with an 18.0% share, is driven by potential breakthroughs in drug development.
- Nanomaterials – It enables advanced material production and, with a 15.0% share, is limited by specialized use cases and high costs.
- Life Sciences – It supports biological experiments and, with a 17.0% share, remains secondary due to limited commercialization.
- 3D Manufacturing – It is advancing in-space construction and, with a 20.0% share, is driven by growing interest in on-demand production.
- Others – It includes niche applications and, with an 8.0% share, remains limited due to fragmented demand.
Segments Covered in the Report
By Type
- Space-for-Space Manufacturing Service
- Space-for-Earth Manufacturing Service
- Space-for-Surface Manufacturing Service
By Application
- Semiconductors
- Pharmaceuticals
- Nanomaterials
- Life Sciences
- 3D Manufacturing
- Others
By Region
- North America
- Europe
- Asia Pacific
- Latin America
- Middle East & Africa
| Type | 2025 | 2026 | 2027 | 2028 | 2029 | 2030 | 2031 | 2032 | 2033 | 2034 | 2035 |
|---|---|---|---|---|---|---|---|---|---|---|---|
| Space-for-Space Manufacturing Service | 1087.50 | 1263.10 | 1465.52 | 1698.72 | 1967.22 | 2276.19 | 2631.53 | 3040.00 | 3509.31 | 4048.27 | 4666.93 |
| Space-for-Earth Manufacturing Service | 1812.50 | 2016.88 | 2244.07 | 2496.60 | 2777.25 | 3089.11 | 3435.61 | 3820.54 | 4248.12 | 4722.98 | 5250.29 |
| Space-for-Surface Manufacturing Service | 725.00 | 794.53 | 870.15 | 952.31 | 1041.47 | 1138.09 | 1242.67 | 1355.68 | 1477.61 | 1608.93 | 1750.10 |
| Application | 2025 | 2026 | 2027 | 2028 | 2029 | 2030 | 2031 | 2032 | 2033 | 2034 | 2035 |
|---|---|---|---|---|---|---|---|---|---|---|---|
| Semiconductors | 797.50 | 916.76 | 1053.34 | 1209.69 | 1388.62 | 1593.33 | 1827.45 | 2095.14 | 2401.11 | 2750.75 | 3150.18 |
| Pharmaceuticals | 652.50 | 749.71 | 860.99 | 988.34 | 1134.04 | 1300.68 | 1491.20 | 1708.97 | 1957.83 | 2242.12 | 2566.81 |
| Nanomaterials | 543.75 | 623.40 | 714.44 | 818.47 | 937.32 | 1073.06 | 1228.05 | 1404.97 | 1606.90 | 1837.29 | 2100.12 |
| Life Sciences | 616.25 | 700.81 | 796.87 | 905.98 | 1029.90 | 1170.61 | 1330.38 | 1511.78 | 1717.72 | 1951.47 | 2216.79 |
| 3D Manufacturing | 725.00 | 839.35 | 970.90 | 1122.18 | 1296.05 | 1495.78 | 1725.11 | 1988.33 | 2290.29 | 2636.57 | 3033.50 |
| Others | 290.00 | 244.47 | 183.19 | 102.95 | 0.00 | -130.07 | -292.39 | -492.97 | -738.80 | -1038.02 | -1400.08 |
| Region | 2025 | 2026 | 2027 | 2028 | 2029 | 2030 | 2031 | 2032 | 2033 | 2034 | 2035 |
|---|---|---|---|---|---|---|---|---|---|---|---|
| North America | 1377.50 | 1527.94 | 1694.50 | 1878.88 | 2082.94 | 2308.70 | 2558.43 | 2834.60 | 3139.91 | 3477.36 | 3850.22 |
| Europe | 906.25 | 1006.40 | 1117.46 | 1240.58 | 1377.05 | 1528.30 | 1695.88 | 1881.51 | 2087.12 | 2314.78 | 2566.81 |
| Asia Pacific | 797.50 | 937.14 | 1099.14 | 1286.91 | 1504.34 | 1755.91 | 2046.75 | 2382.70 | 2770.51 | 3217.86 | 3733.54 |
| Latin America | 290.00 | 321.89 | 357.22 | 396.37 | 439.73 | 487.75 | 540.93 | 599.78 | 664.92 | 736.99 | 816.71 |
| Middle East & Africa | 253.75 | 281.14 | 311.42 | 344.89 | 381.87 | 422.72 | 467.83 | 517.62 | 572.57 | 633.19 | 700.04 |
Research Methodology
Related Databooks
April 2026
April 2026
April 2026
April 2026

 sales@precedenceresearch.com
 +1 804-441-9344
 Download Databook
 Schedule a Meeting