Middle East Feeder and Distribution Pillar Market Size is USD 293.85 Million in 2026
Middle East Feeder and Distribution Pillar Market (By Type: Single Phase, Three Phase; By Application: Smart Grid, Commercial Premises, Light Industrial, Outdoor And Indoor Power Delivery) Industry Size, Share, Growth, Trends 2026 to 2035.


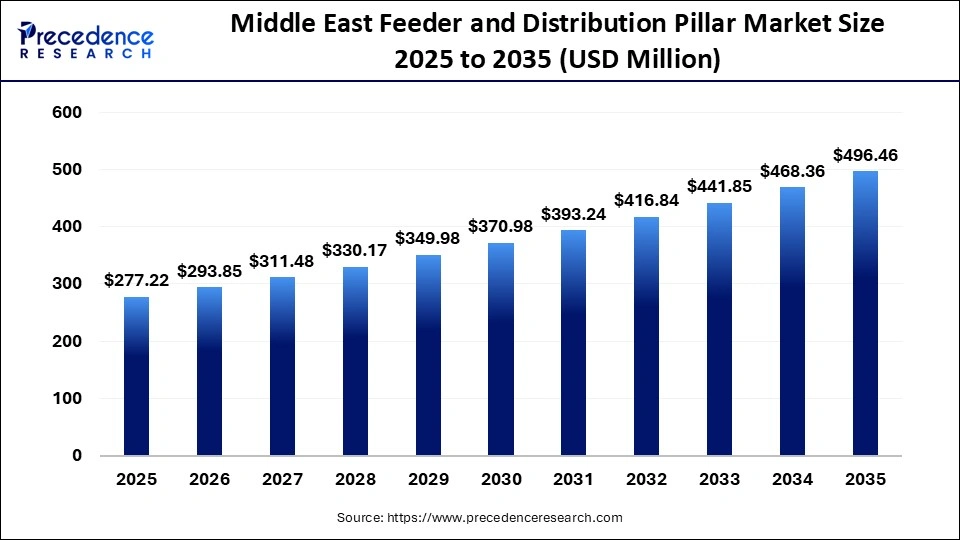
The Middle East feeder and distribution pillar market size was estimated at USD 277.22 million in 2025 and is expanding at a CAGR of 6.00% from 2026 to 2035. Rapid urbanization and industrialization are driving the market.
Middle East Feeder and Distribution Pillar Market Statical Scope
| Reports Attributes | Statistics |
| Market Size in 2025 | USD 277.22 Million |
| Market Size in 2026 | USD 293.85 Million |
| Market Size by 2035 | USD 496.46 Million |
| CAGR 2026 to 2035 | 6% |
| Base Year | 2025 |
| Forecast Period | 2026 to 2035 |
The industry is expected to see an increase in demand for commercial and light industrial applications during the forecast period. The growing need for efficient low-voltage outdoor electricity distribution, combined with the emerging real estate sector and industrial growth in the region, is anticipated to drive this demand.
Companies are extensively using high-quality raw materials to ensure the reliability of feeder and distribution pillars, resulting in low ownership costs, reduced maintenance requirements, improved service life, less cabling, reduced indoor floor space, and safe, easy usability.
Middle East feeder and distribution pillar market share, By Country, 2025
- UAE - The rapid population growth in the country, driven by extensive modernization and infrastructure development, along with the expansion of urban areas, has created a substantial demand for robust electrical infrastructure.
Middle East Feeder and Distribution Pillar Market Share, By Type, 2025, (%)
| Segments | Shares (%) |
| Three-phase | 74% |
| Two-phase | 26% |
- Three-phase - It leads due to higher efficiency and suitability for heavy-load power distribution systems, holding a 74% share in the market.
- Two-phase - this segment is growing due to rapid, smart, and sustainable modernization, and it is limited to lower-load and residential applications, captures 26% share.
Middle East Feeder and Distribution Pillar Market Share, By Application, 2025, (%)
| Segments | Shares (%) |
| Commercial premises | 38% |
| Smart grid | 22% |
| Light industrial | 20% |
| Outdoor & indoor power delivery | 20% |
- Commercial premises - It dominates because of high electricity demand across offices, malls, and buildings, capturing a 38% share.
- Smart grid - It is expanding with rising investments in modern grid infrastructure and energy efficiency, holding a 22% share.
- Light industrial - fast infrastructure development, industrial diversification, and the growth of free trade zones are driving this segment and holds 20% share.
- Outdoor & indoor power delivery - smart grid adoption and infrastructure expansion are expanding the segment growth with 20% share.
Top Companies in the Middle East Nanocatings Market
- Charles Endirect
- Emirates Transformer and Switchgear Ltd.
- Federal Switchgear
- Hager Group
- Khalid Electrical & Mechanical Co. (KEMCO)
- Qatar International Electrical Co. WLL
- Schneider Electric
- Verger Delporte UAE Ltd.
- Al-Salam Industrial And Trading Est
- TechnoGroup
Segments Covered in the Report
By Type
- Single Phase
- Three Phase
By Application
- Smart Grid
- Commercial Premises
- Light Industrial
- Outdoor And Indoor Power Delivery
| Type | 2025 | 2026 | 2027 | 2028 | 2029 | 2030 | 2031 | 2032 | 2033 | 2034 | 2035 |
|---|---|---|---|---|---|---|---|---|---|---|---|
| Single Phase | 0.38 | 0.48 | 0.42 | 0.42 | 0.44 | 0.37 | 0.41 | 0.36 | 0.37 | 0.47 | 0.44 |
| Three Phase | 172.66 | 152.88 | 180.66 | 189.97 | 195.54 | 233.29 | 233.75 | 266.98 | 279.28 | 246.16 | 278.93 |
| Application | 2025 | 2026 | 2027 | 2028 | 2029 | 2030 | 2031 | 2032 | 2033 | 2034 | 2035 |
|---|---|---|---|---|---|---|---|---|---|---|---|
| Smart Grid | 0.40 | 0.39 | 0.37 | 0.40 | 0.40 | 0.38 | 0.38 | 0.41 | 0.40 | 0.33 | 0.33 |
| Commercial Premises | 88.52 | 91.32 | 94.30 | 102.71 | 83.99 | 95.60 | 110.69 | 99.48 | 137.13 | 133.56 | 158.80 |
| Light Industrial | 40.81 | 47.13 | 61.07 | 42.53 | 78.90 | 79.07 | 70.77 | 89.80 | 57.95 | 87.58 | 84.69 |
| Outdoor And Indoor Power Delivery | 37.36 | 39.49 | 39.89 | 54.49 | 46.43 | 55.37 | 63.06 | 57.50 | 70.80 | 94.50 | 88.09 |
Research Methodology
Related Databooks
March 2026
April 2026
April 2026
April 2026

 sales@precedenceresearch.com
 +1 804-441-9344
 Download Databook
 Schedule a Meeting