Middle East Nanomaterials Market Size is USD 246.77 Million in 2026
Middle East Nanomaterials Market (By Material: Gold (Au), Silver (Ag), Iron (Fe), Copper (Cu), Platinum (Pt), Titanium (Ti), Nickel (Ni), Aluminum Oxide, Antimony Tin Oxide, Bismuth Oxide, Carbon Nanotubes, Other Nanomaterials; By Application: Aerospace, Automotive, Medical, Energy & Power, Electronics, Paints & Coatings, Other Applications) Industry Size, Share, Growth, Trends 2026 to 2035.


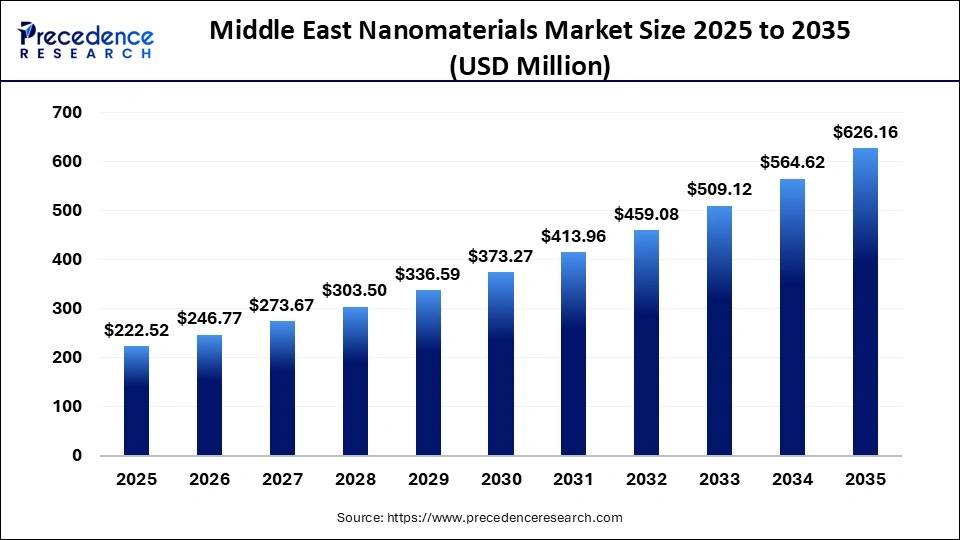
The Middle East nanomaterials market size was estimated at USD 222.52 million in 2025 andis expanding at a CAGR of 10.9% from 2026 to 2035. Due to rising demand for advanced materials across energy, healthcare, and construction sectors, strong government support, and R & D investments, and the adoption of nanotechnology to boost efficiency, sustainability, and performance in industrial applications.
Middle East Nanomaterials Market Statical Scope
| Reports Attributes | Statistics |
| Market Size in 2025 | USD 222.52 Million |
| Market Size in 2026 | USD 246.77 Million |
| Market Size by 2035 | USD 626.16 Million |
| CAGR 2026 to 2035 | 10.9% |
| Base Year | 2025 |
| Forecast Period | 2026 to 2035 |
It is benefiting from notable technological advances that have enhanced performance, broadening its obligations. Companies and resource centers in the region are refining synthesis and fabrication techniques to produce smaller, more uniform antiparticles with superior properties for energy storage, healthcare diagnostics, and smart coating. There's growing integration of nanotechnology in two renewable energy systems, advanced medical devices , and high-strength industrial materials. These innovations, supported by government and R & D investments, are helping to tailor nanomaterials for region-specific needs while improving efficiency, durability, and functionality across sectors.
Middle East Nanomaterials Market Share, By Country, 2025 (%)
- UAE- The nanomaterials market is expanding as the country pushes technological innovation and sustainable development, and demand is rising in advanced construction and energy storage. Water purification and biomedical applications are supported by strong government initiatives and R & D investments. It focuses on smart cities, green buildings, and healthcare innovation, attracts global players, and drives the adoption of high-performance nanomaterials across key industries.
- Saudi Arabia- Due to its rapid expansion as part of diversifying beyond oil and building high-tech industries with strong investments in research, local production, and advanced applications in energy, healthcare, electronics, and construction, our driving demand for collaboration between universities and global partners fuels innovation, while robust infrastructure and our commercialization of nano-enhanced materials across key sectors.
Middle East Nanomaterials Market Share, By Material, 2025 (%)
| Segments | Shares (%) |
| Gold (Au) | 9% |
| Silver (Ag) | 10% |
| Iron (Fe) | 6% |
| Copper (Cu) | 11% |
| Platinum (Pt) | 3% |
| Titanium (Ti) | 25% |
| Nickel (Ni) | 8% |
| Aluminium Oxide | 12% |
| Antimony Tin Oxide | 4% |
| Bismuth Oxide | 5% |
| Carbon Nanotubes | 7% |
- Gold (Au)- The segment accounted for 9% of the total market share, due to its specialization in high-cost applications like precision medicine , diagnostics, and research, which aren narrower in scope compared with broader high- volume uses of materials like titanium or silver. Its limited industrial adoption and higher production costs also keep its market contribution smaller.
- Silver (Ag)- The segment accounted for 10% of the total market share, due to its specialized use in antimicrobial coatings, electronics, and medical devices, with demand limited by higher costs and niche applications.
- Iron (Fe)- The segment accounted for 6% of the total market share, driven by its use in magnetic materials, catalysts, and environmental applications, though broader adoption is limited compared to high-demand nanomaterials like titanium or silica.
- Copper (Cu)- The segment accounted for 11% of the total market share, due to its wide use in electronics, conductivity coatings, and renewable energy applications, supported by increasing industrial demand and technological adoption.
- Platinum (Pt)- The segment accounted for 3% of the total market share, due to its high cost and limited applications in catalyst electronics and specialized medical devices, restricting wider industrial use.
- Titanium (Ti)- The segment dominated the market with a 25% share, due to its high strength, corrosion resistance, and versatility in aerospace construction, medical, and industrial applications, driven by widespread adoption.
- Nickel (Ni)- The segment accounted for 8% of the total market share, driven by its use of battery coatings and catalysts, but its adoption is moderate compared to high-demand materials like titanium.
- Aluminium Oxide- The segment accounted for 12% of the total market share, due to its widespread use in ceramic coatings and electronics, offering durability, thermal stability, and cost-effective performance across industries.
- Antimony Tin Oxide- The segment accounted for 4% of the total market share, due to its specialized use in transparent conductive coating electronics and solar applications, limiting broader adoption.
- Bismuth Oxide- The segment accounted for 5% of the total market share, due to its applications in electronics, pharmaceuticals, and ceramics, with adaptation limited by niche usage and specialized industrial needs.
- Carbon Nanotubes- The segment accounted for 7% of the total market share, due to its high cost and specialized applications in electronics, composites, and energy storage, limiting widespread industrial adoption.
Middle East Nanomaterials Market Share, By Application, 2025 (%)
| Segments | Shares (%) |
| Aerospace | 10% |
| Automotive | 14% |
| Medical | 32% |
| Energy & Power | 20% |
| Electronics | 9% |
| Paints & Coatings | 15% |
- Aerospace- The segment accounted for 10% of the total market share, driven by demand for lightweight high-strength materials that improve fuel efficiency, durability, and performance in aircraft and defense applications.
- Automotive- The segment accounted for 14% of the total market share, driven by demand for lightweight, durable, and high-performance materials that enhance fuel efficiency, safety, and longevity in vehicles.
- Medical- The segment dominated the market with a 32% share, due to high demand for advanced diagnostic drug delivery in plants and antimicrobial applications, driving widespread adoption in healthcare.
- Energy & Power- The segment accounted for 20% of the total market share, driven by applications in batteries, dual sales, and renewable energy technologies, enhancing efficiency and performance in the energy sector.
- Electronics- The segment accounted for 9% of the total market share, fueled by demand for miniaturized high-performance components in semiconductors, sensors, and conductive materials supporting technological innovation.
- Paints & Coatings- The segment accounted for 15% of the total market share, due to rising demand for durable corrosion-resistant and multifunctional coatings in construction, automotive, and industrial applications.
Top Companies in the Middle East Nanomaterials Market
- Saudi Aramco
- SABIC
- Masdar
- Advanced Materials Company (AMC)
- NanoTech Egypt
- Zyvex Technologies
- R.Evolution Nanomaterials FZE
Segments Covered in the Report
By Material
- Gold (Au)
- Silver (Ag)
- Iron (Fe)
- Copper (Cu)
- Platinum (Pt)
- Titanium (Ti)
- Nickel (Ni)
- Aluminum Oxide
- Antimony Tin Oxide
- Bismuth Oxide
- Carbon Nanotubes
- Other Nanomaterials
By Application
- Aerospace
- Automotive
- Medical
- Energy & Power
- Electronics
- Paints & Coatings
- Other Applications
| Material | 2025 | 2026 | 2027 | 2028 | 2029 | 2030 | 2031 | 2032 | 2033 | 2034 | 2035 |
|---|---|---|---|---|---|---|---|---|---|---|---|
| Gold (Au) | 17.80 | 19.62 | 21.62 | 23.82 | 26.25 | 28.93 | 31.87 | 35.12 | 38.69 | 42.63 | 46.96 |
| Silver (Ag) | 22.25 | 24.55 | 27.09 | 29.89 | 32.99 | 36.39 | 40.15 | 44.30 | 48.88 | 53.92 | 59.49 |
| Iron (Fe) | 15.58 | 17.15 | 18.88 | 20.79 | 22.89 | 25.20 | 27.74 | 30.53 | 33.60 | 36.98 | 40.70 |
| Copper (Cu) | 13.35 | 14.68 | 16.15 | 17.75 | 19.52 | 21.46 | 23.60 | 25.94 | 28.51 | 31.34 | 34.44 |
| Platinum (Pt) | 11.13 | 12.22 | 13.41 | 14.72 | 16.16 | 17.73 | 19.46 | 21.35 | 23.42 | 25.69 | 28.18 |
| Titanium (Ti) | 17.80 | 19.62 | 21.62 | 23.82 | 26.25 | 28.93 | 31.87 | 35.12 | 38.69 | 42.63 | 46.96 |
| Nickel (Ni) | 15.58 | 17.15 | 18.88 | 20.79 | 22.89 | 25.20 | 27.74 | 30.53 | 33.60 | 36.98 | 40.70 |
| Aluminum Oxide | 22.25 | 24.92 | 27.91 | 31.26 | 35.01 | 39.19 | 43.88 | 49.12 | 54.98 | 61.54 | 68.88 |
| Antimony Tin Oxide | 13.35 | 14.68 | 16.15 | 17.75 | 19.52 | 21.46 | 23.60 | 25.94 | 28.51 | 31.34 | 34.44 |
| Bismuth Oxide | 11.13 | 12.22 | 13.41 | 14.72 | 16.16 | 17.73 | 19.46 | 21.35 | 23.42 | 25.69 | 28.18 |
| Carbon Nanotubes | 26.70 | 29.86 | 33.39 | 37.33 | 41.74 | 46.66 | 52.16 | 58.30 | 65.17 | 72.84 | 81.40 |
| Other Nanomaterials | 35.60 | 39.36 | 43.51 | 48.10 | 53.18 | 58.79 | 64.99 | 71.85 | 79.42 | 87.80 | 97.05 |
| Application | 2025 | 2026 | 2027 | 2028 | 2029 | 2030 | 2031 | 2032 | 2033 | 2034 | 2035 |
|---|---|---|---|---|---|---|---|---|---|---|---|
| Aerospace | 31.15 | 34.42 | 38.04 | 42.03 | 46.45 | 51.32 | 56.71 | 62.66 | 69.24 | 76.51 | 84.53 |
| Automotive | 28.93 | 31.96 | 35.30 | 39.00 | 43.08 | 47.59 | 52.57 | 58.07 | 64.15 | 70.86 | 78.27 |
| Medical | 35.60 | 39.36 | 43.51 | 48.10 | 53.18 | 58.79 | 64.99 | 71.85 | 79.42 | 87.80 | 97.05 |
| Energy & Power | 40.05 | 44.67 | 49.81 | 55.54 | 61.93 | 69.05 | 77.00 | 85.85 | 95.71 | 106.71 | 118.97 |
| Electronics | 44.50 | 49.60 | 55.28 | 61.61 | 68.66 | 76.52 | 85.28 | 95.03 | 105.90 | 118.01 | 131.49 |
| Paints & Coatings | 24.48 | 27.02 | 29.83 | 32.93 | 36.35 | 40.13 | 44.29 | 48.89 | 53.97 | 59.57 | 65.75 |
| Other Applications | 17.80 | 19.62 | 21.62 | 23.82 | 26.25 | 28.93 | 31.87 | 35.12 | 38.69 | 42.63 | 46.96 |
Research Methodology
Related Databooks
March 2026
March 2026
April 2026
April 2026


 +1 804-441-9344
 Download Databook
 Schedule a Meeting