North America Micro Market Size is USD 6.61 Billion in 2026
North America Micro Market (By Channel: Business and Industry, Education, Entertainment Venues, Travel and Leisure, Healthcare, Others) Industry Size, Share, Growth, Trends 2026 to 2035.


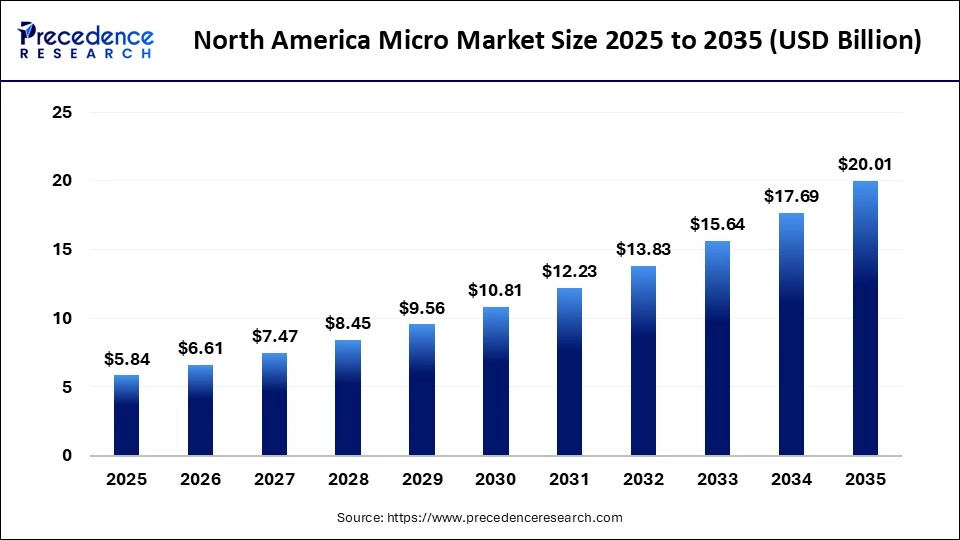
The North America micro market size was estimated at USD 5.84 billion in 2025 and is predicted to increase from USD 6.61 billion in 2026 to approximately USD 20.01 billion by 2035, expanding at a CAGR of 13.10% from 2026 to 2035. High convenience and easy availability of micro markets are growing their demand across North America.
North America Micro Market Statical Scope
| Reports Attributes | Statistics |
| Market Size in 2025 | USD 5.84 Billion |
| Market Size in 2026 | USD 6.61 Billion |
| Market Size by 2035 | USD 20.01 Billion |
| CAGR 2026 to 2035 | 13.10% |
| Base Year | 2025 |
| Forecast Period | 2026 to 2035 |
Micro-markets are unattended stores that provide customers with self-service access to food and beverages around the clock. They are commonly located in large workplaces, hotels, employee breakrooms, campus dining halls, gift shops, and apartment buildings. Unlike vending machines, micro-markets feature open shelving that allows employees or guests easy access to a wide variety of food and drink options at any time, ensuring customer satisfaction and encouraging repeat visits.
Advancements in micro-market technology have enabled their expansion into high-traffic areas such as hotel lobbies, airports, and college campuses. In these settings, secure, locked smart coolers facilitate reliable sales even when transient populations are predominant.
The technology driving micro markets includes self-checkout systems integrated with mobile payments options, touchscreens, and barcode scanners. These features streamline the shopping experience, eliminate the need for cashiers, and reduce wait times. Additionally, real-time data analytics and inventory management systems allow operators to monitor sales, track stock levels, and analyze product pricing and offerings.
Artificial intelligence also powers micro markets, enhancing operations and improving customer interactions. AI applications range from machine learning algorithms for demand forecasting and inventory management to computer vision systems that monitor product movement and voice assistants that answer customer inquiries.
In the U.S., the business and industrial sectors have seen a significant rise in the popularity of micro markets. These self-service retail locations offer a practical and innovative way for employees and guests to access a variety of food and drink options without relying on traditional vending machines or cafeteria services.
North America Micro Market Share, By Channel, 2025 (%)
| Segments | Shares (%) |
| Business and Industry | 28% |
| Healthcare | 25% |
| Education | 15% |
| Entertainment Venues | 12% |
| Travel and Leisure | 10% |
| Others | 10% |
- Business and Industry - High adoption for training, simulation, and operational efficiency, with a 28% share, establishes this as the leading application segment.
- Healthcare - Growing use in medical training and patient care, with a 25% share, supports demand but remains below business and industry.
- Education - Increasing integration in learning and virtual classrooms, with a 15% share, contributes but does not lead the market.
- Entertainment Venues - Strong demand for immersive experiences, with a 12% share, supports the market but remains limited.
- Travel and Leisure - Use in virtual tourism and experiences, with a 10% share, restricts broader dominance.
- Others - Diverse smaller applications, with a 10% share, result in moderate overall contribution.
Top Companies of North America Micro Market
- Canteen Vending Services
- Avanti Markets
- 365 Retail Markets
- Five Star Food Service
- Compass Group
- Aramark
- Royal Vendors, Inc.
- Sodexo
Segments Covered in the Report
By Channel
- Business and Industry
- Education
- Entertainment Venues
- Travel and Leisure
- Healthcare
- Others
| Market Forecast | 2025 | 2026 | 2027 | 2028 | 2029 | 2030 | 2031 | 2032 | 2033 | 2034 | 2035 |
|---|---|---|---|---|---|---|---|---|---|---|---|
| Business and Industry | 1.64 | 0.30 | 0.06 | 0.01 | 0.00 | 0.00 | 0.00 | 0.00 | 0.00 | 0.00 | 0.00 |
| Education | 0.88 | 0.17 | 0.03 | 0.01 | 0.00 | 0.00 | 0.00 | 0.00 | 0.00 | 0.00 | 0.00 |
| Entertainment Venues | 0.70 | 0.13 | 0.02 | 0.00 | 0.00 | 0.00 | 0.00 | 0.00 | 0.00 | 0.00 | 0.00 |
| Travel and Leisure | 0.58 | 0.11 | 0.02 | 0.00 | 0.00 | 0.00 | 0.00 | 0.00 | 0.00 | 0.00 | 0.00 |
| Healthcare | 1.46 | 0.28 | 0.05 | 0.01 | 0.00 | 0.00 | 0.00 | 0.00 | 0.00 | 0.00 | 0.00 |
| Others | 0.58 | 0.11 | 0.02 | 0.00 | 0.00 | 0.00 | 0.00 | 0.00 | 0.00 | 0.00 | 0.00 |
Research Methodology
Related Databooks
April 2026
April 2026
June 2026
April 2026

 sales@precedenceresearch.com
 +1 804-441-9344
 Download Databook
 Schedule a Meeting