North America Microencapsulation Market Size is USD 6.25 Billion in 2026
North America Microencapsulation Market (By Application: Pharmaceutical & Healthcare Products, Home & Personal Care, Food & Beverages, Agrochemicals, Construction, Textile, Others; By Technology: Coating, Emulsion, Spray Technologies, Dripping, Others) Industry Size, Share, Growth, Trends 2026 to 2035.


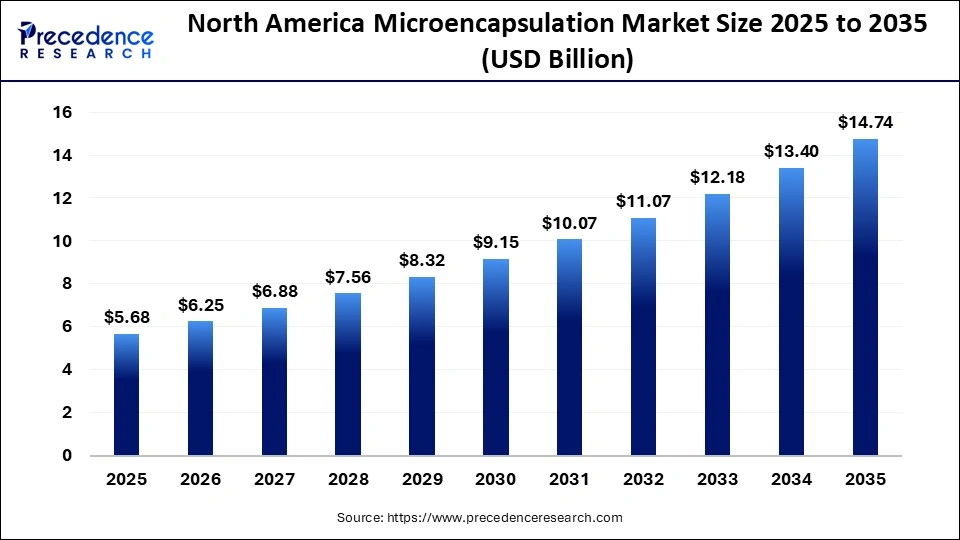
The North America microencapsulation market size was estimated at USD 5.68 billion in 2025 and is predicted to increase from USD 6.25 billion in 2026 to approximately USD 14.74 billion by 2035, expanding at a CAGR of 10.00% from 2026 to 2035. Rising demand for advanced delivery systems in pharmaceuticals, food, and beverages is expanding the market in North America.
North America Microencapsulation Market Statical Scope
| Reports Attributes | Statistics |
| Market Size in 2025 | USD 5.68 Billion |
| Market Size in 2026 | USD 6.25 Billion |
| Market Size by 2035 | USD 14.74 Billion |
| CAGR 2026 to 2035 | 10.00% |
| Base Year | 2025 |
| Forecast Period | 2026 to 2035 |
The microencapsulation market involves the production, sale, and development of microencapsulation technologies. This process coats active pharmaceutical ingredients in a protective shell to enhance their stability and manageability. Microencapsulation improves the overall shelf life and stability of these ingredients by enabling controlled release of the API.
In North America, there is a growing consumer demand for functional and fortified food products, dietary supplements, and personal care items. Microencapsulation facilitates the controlled release of active ingredients, thereby enhancing the effectiveness and appeal of these products. The pharmaceutical industry heavily relies on microencapsulation for drug delivery systems, targeted drug release, taste masking, and improving drug stability. The increasing prevalence of chronic diseases, alongside advancements in drug delivery technologies, further drives the demand for microencapsulation in this sector.
The personal care and cosmetics industry is also experiencing a surge in demand for microencapsulation, motivated by the need for greater product efficacy and improved consumer experiences. This technology allows for the controlled release of fragrances, moisturizing agents, vitamins, and other active ingredients, enhancing the functionality of various products, from skincare and hair care to color cosmetics.
Additionally, AI-driven data analytics support the customization of microencapsulation techniques tailored to specific ingredients and desired release profiles. This personalization enhances bioavailability and efficacy, making products more attractive to health-conscious consumers. The adoption of machine learning algorithms accelerates research and development cycles, facilitating rapid innovation and testing of new encapsulation materials and methods.
In the field of regenerative medicine, microencapsulation technology is improving stem cell viability, tissue repair, and controlled drug delivery, thus making therapies more effective. The combination of microencapsulation and AI is creating promising opportunities in pharmaceuticals and personalized medicine, highlighting key trends in the microencapsulation industry.
North America Microencapsulation Market Share, By Application, 2025 (%)
| Segments | Shares (%) |
| Pharmaceutical & Healthcare Products | 63% |
| Home & Personal Care | 10% |
| Food & Beverages | 8% |
| Agrochemicals | 5% |
| Construction | 4% |
| Textile | 3% |
| Others | 7% |
- Pharmaceutical & Healthcare Products - High demand for controlled-release and protective coating applications, with a 63% share, establishes this as the leading end-use segment.
- Home & Personal Care - Moderate use in cosmetics and hygiene products, with a 10% share, supports demand but remains below pharmaceuticals.
- Food & Beverages - Growing use in flavor and nutrient encapsulation, with an 8% share, contributes but does not lead the market.
- Agrochemicals - Application in controlled-release fertilizers and pesticides, with a 5% share, limits overall contribution.
- Construction - Niche use in material protection and additives, with a 4% share, restricts broader adoption.
- Textile - Limited application in functional fabrics, with a 3% share, results in minimal contribution.
- Others - Diverse smaller applications, with a 7% share, provide moderate contribution without leading the market.
North America Microencapsulation Market Share, By Technology, 2025 (%)
| Segments | Shares (%) |
| Coating | 30% |
| Emulsion | 25% |
| Spray Technologies | 25% |
| Dripping | 10% |
| Others | 10% |
- Coating - Widely used for protection and controlled release across industries, with a 30% share, establishes coating as the leading technology segment.
- Emulsion - Strong use in formulation processes, with a 25% share, supports demand but remains below coating dominance.
- Spray Technologies - Efficient for large-scale production and uniform application, with a 25% share, contribute significantly but do not surpass the leading segment.
- Dripping - Limited and specialized application methods, with a 10% share, restrict broader market contribution.
- Others - Various alternative technologies, with a 10% share, result in moderate overall impact.
Top Companies of North America Microencapsulation Market
- CAPSULE
- Lycored
- BASF
- Balchem Corp.
- Encapsys, LLC
- AVEKA Group
- Reed Pacific
- Microtek Laboratories, Inc
- GAT Microencapsulation GmbH
- Ronald T. Dodge Company
- Evonik Industries AG
- Inno Bio Limited
- Bayer AG
- Dow
- 3M
Segments Covered in the Report
By Application
- Pharmaceutical & Healthcare Products
- Home & Personal Care
- Food & Beverages
- Agrochemicals
- Construction
- Textile
- Others
By Technology
- Coating
- Emulsion
- Spray Technologies
- Dripping
- Others
| Application | 2025 | 2026 | 2027 | 2028 | 2029 | 2030 | 2031 | 2032 | 2033 | 2034 | 2035 |
|---|---|---|---|---|---|---|---|---|---|---|---|
| Pharmaceutical & Healthcare Products | 3.58 | 3.94 | 4.33 | 4.76 | 5.24 | 5.77 | 6.35 | 6.99 | 7.69 | 8.46 | 9.30 |
| Home & Personal Care | 0.57 | 0.63 | 0.70 | 0.78 | 0.87 | 0.97 | 1.08 | 1.20 | 1.33 | 1.49 | 1.64 |
| Food & Beverages | 0.46 | 0.51 | 0.56 | 0.62 | 0.69 | 0.76 | 0.85 | 0.94 | 1.04 | 1.15 | 1.27 |
| Agrochemicals | 0.29 | 0.32 | 0.35 | 0.39 | 0.43 | 0.48 | 0.53 | 0.59 | 0.66 | 0.73 | 0.81 |
| Construction | 0.23 | 0.26 | 0.29 | 0.33 | 0.37 | 0.42 | 0.47 | 0.53 | 0.59 | 0.66 | 0.74 |
| Textile | 0.17 | 0.20 | 0.22 | 0.26 | 0.30 | 0.34 | 0.38 | 0.43 | 0.49 | 0.55 | 0.62 |
| Others | 0.40 | 0.44 | 0.49 | 0.53 | 0.58 | 0.64 | 0.70 | 0.77 | 0.85 | 0.94 | 1.04 |
| Total Market Size | 5.68 | 6.25 | 6.87 | 7.55 | 8.28 | 9.06 | 9.90 | 10.80 | 11.75 | 12.77 | 13.85 |
| Technology | 2025 | 2026 | 2027 | 2028 | 2029 | 2030 | 2031 | 2032 | 2033 | 2034 | 2035 |
|---|---|---|---|---|---|---|---|---|---|---|---|
| Coating | 1.70 | 1.87 | 2.06 | 2.27 | 2.50 | 2.75 | 3.02 | 3.32 | 3.65 | 4.01 | 4.41 |
| Emulsion | 1.42 | 1.56 | 1.72 | 1.89 | 2.08 | 2.28 | 2.51 | 2.76 | 3.03 | 3.32 | 3.65 |
| Spray Technologies | 1.42 | 1.56 | 1.72 | 1.89 | 2.08 | 2.28 | 2.51 | 2.76 | 3.03 | 3.32 | 3.65 |
| Dripping | 0.57 | 0.62 | 0.68 | 0.74 | 0.81 | 0.89 | 0.98 | 1.08 | 1.18 | 1.29 | 1.42 |
| Others | 0.57 | 0.62 | 0.68 | 0.74 | 0.81 | 0.89 | 0.98 | 1.08 | 1.18 | 1.29 | 1.42 |
| Total Market Size | 5.68 | 6.25 | 6.87 | 7.55 | 8.28 | 9.06 | 9.90 | 10.80 | 11.75 | 12.77 | 13.85 |
Research Methodology
Related Databooks
March 2026
March 2026
April 2026
April 2026

 sales@precedenceresearch.com
 +1 804-441-9344
 Download Databook
 Schedule a Meeting