North America Polyamide Market Size is USD 5.94 Billion in 2026
North America Polyamide Market (By Product: Polyamide 6, Polyamide 66, Bio-based Polyamide, Specialty Polyamides; By Application: Automotive, Electrical & Electronics, Household Goods & Appliances, Others) Industry Size, Share, Growth, Trends 2026 to 2035.


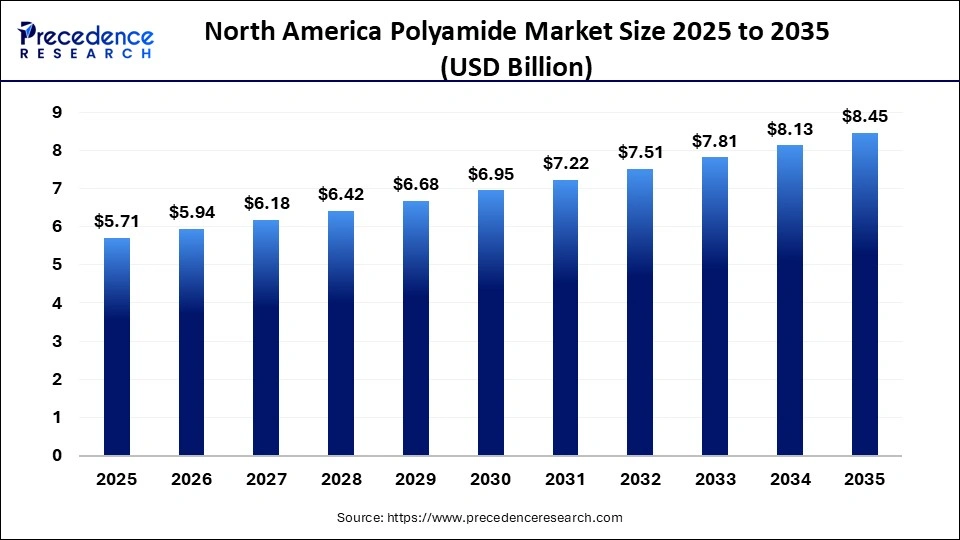
The North America polyamide market size was estimated at USD 5.71 billion in 2025 and is predicted to increase from USD 5.94 billion in 2026 to approximately USD 8.45 billion by 2035, expanding at A CAGR of 4% from 2026 to 2035. The market is rapidly expanding, driven by the automotive, textile, and electronics sectors.
North America Polyamide Market Statical Scope
| Reports Attributes | Statistics |
| Market Size in 2025 | USD 5.71 Billion |
| Market Size in 2026 | USD 5.94 Billion |
| Market Size by 2035 | USD 8.45 Billion |
| CAGR 2026 to 2035 | 4% |
| Base Year | 2025 |
| Forecast Period | 2026 to 2035 |
This growth is fueled by the lightweighting trend in vehicles and the demand for high-performance textiles. There is significant demand for polyamide compounds, particularly PA6 and PA66, as they replace metal parts, reducing vehicle weight and enhancing efficiency. Polyamides are favored for their mechanical strength, thermal stability, and chemical resistance, making them ideal for engine components and structural applications.
Additionally, there is a strong demand for nylon fibers in activewear and industrial textiles. Investments in bio-based polyamides from castor oil and recycling technologies are increasing to meet environmental standards. The industry is also adapting to regional supply chain changes and the rising need for technical components, solidifying its position as a key supplier for high-performance applications in North America.
The market benefits from a strong U.S. manufacturing base, a solid petrochemical infrastructure for raw materials, and a growing demand for sustainable, high-performance materials. Polyamides are crucial for enhancing fuel efficiency while ensuring structural integrity in lightweight electric vehicle designs. There is significant demand for high-temperature polyamide grades in electrical components, connectors, and 5G infrastructure, due to their excellent thermal stability and insulation properties.
The region boasts strong vertical integration and a well-established supply chain for key feedstock materials like adipic acid and hexamethylenediamine. The trend of reshoring manufacturing in the U.S. keeps local production competitive. The market excels in specialized, durable applications, such as aerospace engineering and industrial machinery. The rising use of bio-based and recyclable specialty polyamides aligns with regulatory demands for eco-friendly materials, further driving market innovation.
The North American polyamide market is significant, projected to reach 998.58 kilotons by 2031, driven by the rise of electric vehicles (EVs) and stringent lightweighting regulations. It caters to a robust industrial sector focused on high-performance engineering plastics for automotive, electronics, and aerospace applications.
Key growth factors include local sourcing of competitive raw materials, a trend towards reshoring manufacturing, and a shift to recycled and bio-based polyamide formulations. Increased EV adoption is driving demand for high-performance PA6 and PA66 materials essential for battery housing, structural components, and high-voltage connectors, enhancing vehicles.
Additionally, strict CAFÉ fuel efficiency standards encourage automakers to substitute metal with advanced polyamide composites, reducing CO2 emissions and improving energy efficiency. The region enjoys strong petrochemical supply chains, particularly for caprolactam and hexamethylenediamine, providing a cost advantage in polyamide production. The aerospace sector also supports the market by utilizing high-grade, durable polyamides for critical components. Key market players include BASF SE, Honeywell International Inc., and Huntsman Corporation.
North America Polyamide Market Share, By Product, 2025 (%)
| Segments | Shares (%) |
| Polyamide 6 | 52.5% |
| Polyamide 66 | 23% |
| Bio-based Polyamide | 8.5% |
| Specialty Polyamides | 16% |
- Polyamide 6 – It leads product demand due to versatility and cost efficiency and, with a 52.5% share, benefits from widespread use across industries.
- Polyamide 66 – It offers higher performance properties and, with a 23.0% share, lags due to higher cost compared to alternatives.
- Bio-based Polyamide – It is expanding with sustainability trends and, with an 8.5% share, is driven by demand for eco-friendly materials.
- Specialty Polyamides – It serves high-performance niche applications and, with a 16.0% share, is limited by specialized use and higher costs.
North America Polyamide Market Share, By Application, 2025 (%)
| Segments | Shares (%) |
| Automotive | 41% |
| Electrical & Electronics | 26% |
| Household Goods & Appliances | 18% |
| Others | 15% |
Top Companies in the North America Polyamide Market
- Amco Polymers
- Celanese Corporation
- BASF
- Asahi Kasei Plastics North America
- DOMO Engineering Plastics US, LLC
- Adell Plastics, Inc.
- Nylene
- Star Plastics, LLC
- Aurora Material Solutions
- Nytex
- Americhem
- Ultima Plastics
- Conventus Polymers LLC
- Polykemi
- Ingenia Polymers Corp.
- LEHVOSS NORTH AMERICA
- Wellman Advanced Materials
- Osterman North America
- Entec Polymers
- PolyVisions
Segments Covered in the Report
By Product
- Polyamide 6
- Polyamide 66
- Bio-based Polyamide
- Specialty Polyamides
By Application
- Automotive
- Engine covers
- Battery modules (EVs)
- Housing & Connectors
- Instrumental Panels
- Others
- Electrical & Electronics
- Cables & Connectors
- Smartphone Casings
- Laptop Frames
- Enclosures
- Others
- Household Goods & Appliances
- Gears
- Hinges
- Microwave Components
- Others
- Others
| Product | 2025 | 2026 | 2027 | 2028 | 2029 | 2030 | 2031 | 2032 | 2033 | 2034 | 2035 |
|---|---|---|---|---|---|---|---|---|---|---|---|
| Polyamide 6 | 2.00 | 2.07 | 2.15 | 2.23 | 2.31 | 2.40 | 2.48 | 2.58 | 2.67 | 2.77 | 2.87 |
| Polyamide 66 | 1.71 | 1.76 | 1.82 | 1.87 | 1.93 | 1.98 | 2.04 | 2.10 | 2.17 | 2.23 | 2.30 |
| Bio-based Polyamide | 0.57 | 0.61 | 0.65 | 0.69 | 0.74 | 0.79 | 0.84 | 0.89 | 0.95 | 1.01 | 1.07 |
| Specialty Polyamides | 1.43 | 1.49 | 1.56 | 1.63 | 1.70 | 1.78 | 1.86 | 1.94 | 2.03 | 2.12 | 2.22 |
| Application | |||||||||||
|---|---|---|---|---|---|---|---|---|---|---|---|
| Year | 2025.00 | 2026.00 | 2027.00 | 2028.00 | 2029.00 | 2030.00 | 2031.00 | 2032.00 | 2033.00 | 2034.00 | 2035.00 |
| Automotive | 2.28 | 2.36 | 2.45 | 2.53 | 2.62 | 2.71 | 2.80 | 2.90 | 3.00 | 3.10 | 3.21 |
| Electrical & Electronics | 1.43 | 1.50 | 1.57 | 1.64 | 1.72 | 1.81 | 1.89 | 1.98 | 2.08 | 2.18 | 2.28 |
| Household Goods & Appliances | 1.14 | 1.19 | 1.24 | 1.28 | 1.34 | 1.39 | 1.44 | 1.50 | 1.56 | 1.63 | 1.69 |
| Others | 0.86 | 0.89 | 0.93 | 0.96 | 1.00 | 1.04 | 1.08 | 1.13 | 1.17 | 1.22 | 1.27 |
Research Methodology
Related Databooks
March 2026
March 2026
April 2026
April 2026

 sales@precedenceresearch.com
 +1 804-441-9344
 Download Databook
 Schedule a Meeting