U.S. Metaverse Market Size is USD 64.87 Billion in 2026
U.S. Metaverse Market (By Product: Infrastructure, Hardware, Software, Services; By Platform: Desktop, Mobile, Headsets | By Technology: Blockchain, Virtual Reality (VR) & Augmented Reality (AR), Mixed Reality (MR), Others | By Application: Gaming, Online Shopping, Content Creation & Social Media, Events & Conference, Digital Marketing (Advertising), Testing And Inspection, Others | By End-use: Aerospace & Defense, Education, Healthcare, Tourism And Hospitality, BFSI, Retail, Media & Entertainment, Automotive, Others) Industry Size, Share, Growth, Trends 2026 to 2035


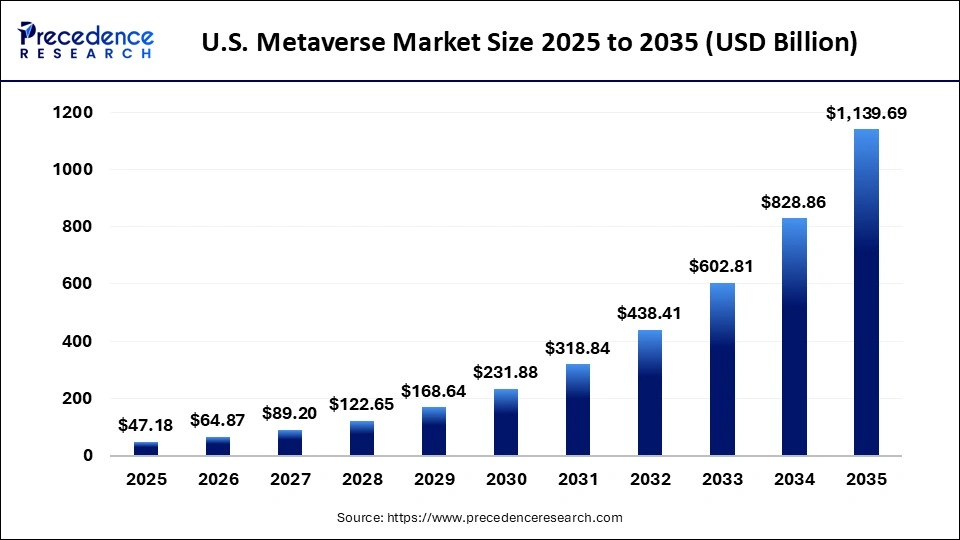
The U.S. metaverse market size was estimated at USD 47.18 billion in 2025 and is predicted to increase from USD 64.87 billion in 2026 to approximately USD 1,139.69 billion by 2035, expanding at A CAGR of 37.5% from 2026 to 2035. Due to increasing investment in virtual augmented reality technologies, growing interest in immersive digital experiences, and the strong presence of major tech companies driving innovations across industries.
North America Microwave Market Statical Scope
| Reports Attributes | Statistics |
| Market Size in 2025 | USD 47.18 Billion |
| Market Size in 2026 | USD 64.87 Billion |
| Market Size by 2035 | USD 1,139.69 Billion |
| CAGR 2026 to 2035 | 37.5% |
| Base Year | 2025 |
| Forecast Period | 2026 to 2035 |
Technological advancements are playing a pivotal role in reshaping the metaverse market in the United States, as continuous innovation in virtual reality, augmented reality, artificial intelligence , and blockchain technologies is enhancing the depth and realism of digital environments. The expansion of high-speed networks, including 5G, further supports seamless real-time attractions within virtual space.
Also, strong Investment by leading technology companies and the integration of immersive platforms across sectors such as gaming, education, healthcare, and retail are exploring adoption, making the matter worse more accessible, scalable, and commercially viable.
The metaverse market represents a growing digital ecosystem using AR and Internet technologies to create immersive virtual experiences driven by strong tech investments, innovations, and expanding applications across the gaming business, education, and entertainment sectors.
U.S. Metaverse Market Share, By Product, 2025 (%)
| Segments | Shares (%) |
| Infrastructure | 22% |
| Hardware | 18% |
| Software | 40% |
| Services | 20% |
- Infrastructure- Serving as a crucial foundation for building and deploying metaverse platforms, it holds a 22% share and supports overall growth, although it remains more scalable and revenue-driven in segments such as software.
- Hardware- It plays a vital role in enabling an immersive experience through devices such as handsets and sensors, folding on 18% share. However, its higher costs and slower adoption rate limits its overall market dominance.
- Software- The backbone of metaverse platforms, applications, and user experiences, this segment leads the market with a 40% share, driven by its scalability and ongoing innovations.
- Services- Increasing demand for integration, consulting, and maintenance services is driving strong growth in this segment, which holds a 20% share as more enterprises adopt and expand their presence in the metaverse.
U.S. Metaverse Market Share, By Technology, 2025 (%)
| Segments | Shares (%) |
| Blockchain | 20% |
| Virtual Reality (VR) & Augmented Reality (AR) | 35% |
| Mixed Reality (MR) | 18% |
| Others | 27% |
- Blockchain- It supports secure transactions and digital ownership, holding a 20% share. However, ongoing scalability issues and regulatory uncertainties continue to limit its wider market dominance.
- Virtual Reality (VR) & Augmented Reality- These technologies play a crucial role in creating immersive and interactive experiences, accounting for a 35% share and driving broad adaptation across a wide range of applications.
- Mixed Reality (MR)- Rising interest in hybrid immersive involvements that blend physical and digital worlds is driving rapid growth in this segment, which accounts for an 18% shares.
- Others- A range of diverse but still evolving technologies, accounting for a 27% share, have yet to achieve the level of unified adoption needed to take a leading position in the market.
U.S. Metaverse Market Share, By Application, 2025 (%)
| Segments | Shares (%) |
| Gaming | 27% |
| Online Shopping | 14% |
| Content Creation & Social Media | 16% |
| Events & Conference | 11% |
| Digital Marketing (Advertising) | 13% |
| Testing and Inspection | 8% |
| Others | 11% |
- Gaming- Strong user engagement and early adoption of immersive environments position this segment as the leading application in the metaverse ecosystem, accounting for a 27% share.
- Online Shopping- Emerging virtual commerce experiences are gaining traction. Holding has a 14% share, but they continue to trail behind more established metaverse applications such as gaming.
- Content Creation & Social Media- Rising user-generated content and virtual interaction, representing a 16% share, are contributing to growth in the metaverse, though they remain secondary to dominant segments like gaming.
- Events &Conference- Adoption of virtual gatherings and corporate events holding an 11% share remains limited compared to more engaging and widely used metaverse applications.
- Digital Marketing (Advertising)- Increasing brand investments in immersive advertising and interactive customer engagement, accounting for a 13% share, are fueling strong growth in this segment by enhancing brand visibility and improving consumer experiences.
- Testing and Inspection- It is a specialized tool used in industrial applications, holding an 8% share, limiting wider adoption within the metaverse ecosystems.
- Others- These segments' use is largely limited to specific niche applications, accounting for an 11% share, which restricts its overall influence and impact on the broader market.
U.S. Metaverse Market Share, By End-Use, 2025 (%)
| Segments | Shares (%) |
| Aerospace & Defense | 9% |
| Education | 35% |
| Healthcare | 11% |
| Tourism and Hospitality | 45% |
- Aerospace & Defense- The use of simulations and training applications, holding an 9% share, remains limited compared to commercial sectors, yet it provides significant benefits in skill development and operational efficiency.
- Education- The increasing adoption of virtual learning environments, accounting for a 35% share, is supporting educational innovation, though its full potential is still hindered by developing infrastructure and limited scalability.
- Healthcare- Applications in training therapy and simulation, holding a 11% share, is steadily growing. They continue to serve specialized niche areas within the broader market.
- Tourism and Hospitality- The rising use of virtual tools and immersive travel experiences, accounting for a 45% share, is driving rapid growth by offering user-engaging interactive experiences, even though it starts from a smaller market base.
Top Companies in the U.S. Metaverse Market
- Meta Platforms, Inc.
- NVIDIA Corporation
- Epic Games, Inc.
- Roblox Corporation
- Unity Technologies, Inc.
- Active Theory
- Google LLC
- Microsoft Corporation
- Inoru
- Maticz Technologies Private Limited
Segments Covered in the Report
By Product
- Infrastructure
- Chips & Processors
- Network Capabilities
- Cloud & Edge Infrastructure
- Cybersecurity
- Chips & Processors
- Hardware
- Holographic Displays
- eXtended Reality (XR) Hardware
- Haptic Sensors & Devices
- Smart Glasses
- Omni Treadmills
- AR/VR Devices
- Others
- Software
- Asset Creation Tools
- Programming Engines
- Virtual Platforms
- Avatar Development
- Services
- User Experiences (Events, Gaming, etc.)
- Asset Marketplaces
- Financial Services
By Platform
- Desktop
- Mobile
- Headsets
By Technology
- Blockchain
- Virtual Reality (VR) & Augmented Reality (AR)
- Mixed Reality (MR)
- Others
By Application
- Gaming
- Online Shopping
- Content Creation & Social Media
- Events & Conference
- Digital Marketing (Advertising)
- Testing And Inspection
- Others
By End-use
- Aerospace & Defense
- Education
- Healthcare
- Tourism And Hospitality
- BFSI
- Retail
- Media & Entertainment
- Automotive
- Others
| Platform | 2025 | 2026 | 2027 | 2028 | 2029 | 2030 | 2031 | 2032 | 2033 | 2034 | 2035 |
|---|---|---|---|---|---|---|---|---|---|---|---|
| Desktop | 13.21 | 13.49 | 13.78 | 14.06 | 14.35 | 14.64 | 14.93 | 15.21 | 15.50 | 15.78 | 16.06 |
| Mobile | 19.82 | 20.85 | 21.94 | 23.09 | 24.28 | 25.54 | 26.87 | 28.25 | 29.70 | 31.22 | 32.82 |
| Headsets | 14.15 | 14.72 | 15.31 | 15.92 | 16.56 | 17.22 | 17.91 | 18.63 | 19.37 | 20.14 | 20.95 |
| Technology | 2025 | 2026 | 2027 | 2028 | 2029 | 2030 | 2031 | 2032 | 2033 | 2034 | 2035 |
|---|---|---|---|---|---|---|---|---|---|---|---|
| Blockchain | 8.49 | 8.78 | 9.08 | 9.39 | 9.71 | 10.04 | 10.39 | 10.74 | 11.11 | 11.48 | 11.87 |
| VR & AR | 19.82 | 20.71 | 21.64 | 22.61 | 23.62 | 24.68 | 25.79 | 26.95 | 28.15 | 29.41 | 30.73 |
| Mixed Reality | 10.38 | 10.94 | 11.53 | 12.15 | 12.80 | 13.49 | 14.21 | 14.96 | 15.76 | 16.59 | 17.46 |
| Others | 8.49 | 8.64 | 8.78 | 8.92 | 9.05 | 9.18 | 9.31 | 9.44 | 9.56 | 9.67 | 9.78 |

 sales@precedenceresearch.com
 +1 804-441-9344
 Download Databook
 Schedule a Meeting