Kratom Market Trends, Size, Share, Key Companies, Production Capacity, and Forecast 2026-2035
Deepa Pandey is a healthcare market research analyst. She researched adoption of kratom products, the demand for powder and capsules, online and retail distribution, any changes in regulation, sourcing trends, and changing consumer preferences. Her research provides insights to manufacturers, distributors, retailers, investors, and industry participants on who is winning, who is losing, and how business is being influenced by the competition in the global Kratom market.
Source: https://www.precedenceresearch.com/kratom-market
 Get a Sample
 Table Of Content


Kratom Market Trends, Share and Growth Analysis
Deepa Pandey has more than 5 years of experience in the healthcare and wellness industry. She states that the kratom market is being taken in a more commercial direction. The demand for plant-based products, traditional botanicals, and alternative wellness products is also on the rise. Manufacturers are more focused on standardized products, quality assurance, product testing, and differentiated formulations. The kratom market is forecasted to expand from USD 4.42 billion in 2026 to USD 14.54 billion by 2035, growing at a CAGR of 14.15% from 2026 to 2035.
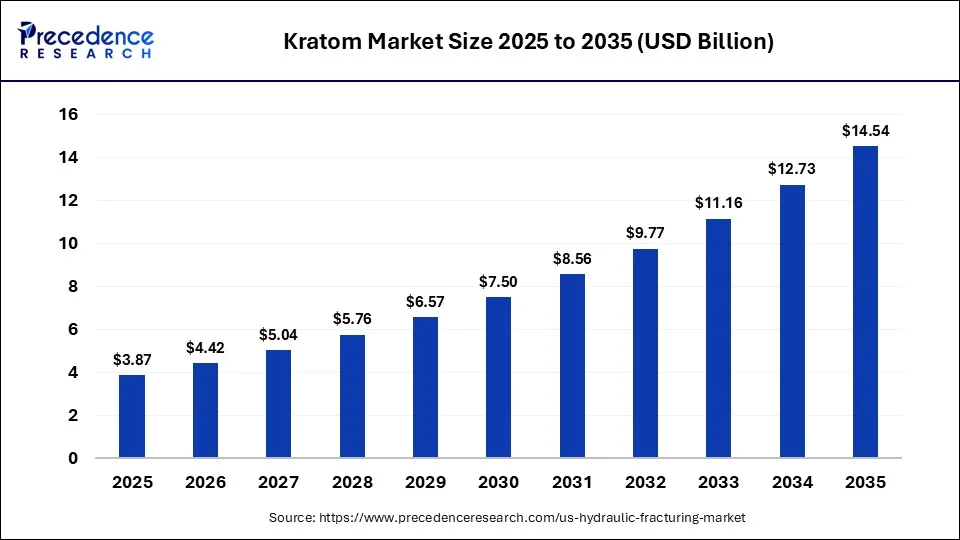
Shifting consumer tastes towards powders, capsules, extracts, and other convenient product types are driving the global market for kratom. The global market for kratom is being driven by changing consumer preferences for powder dosages, capsule dosages, kratom extract, and other convenient product forms. The global Kratom market is expected to grow at a CAGR of 14.15% throughout the forecast period from 2026 to 2035.
Key Takeaways
- By product type, the kratom powder segment led the market with a share of 38.65% in 2026.
- By form, the processed kratom segment led the market with a 71.85% share in 2026.
- By application, the pain management segment captured a major revenue share of 31.45% in 2026.
- By distribution channel, the uncooled segment captured the largest market share of 46.35% in 2026.
- By region, the North America region led the market with a share of 43.25% in 2026.
- While the preference for traditional kratom products is noted, with 38 companies providing powder, only 12 offer gummies. There is a strong preference for traditional kratom products, with 38 companies offering powder, while only 12 offer gummies.
- More companies engage in retail than cultivation, suggesting that companies have less capital to invest in the retail segment of the value chain.
- Between 700% and 1,000% more often in 2021 than in 2025, and the majority of the regulatory inquiries have been against 7-OH products and not the natural leaf from which they are extracted.
- Nearly everyone is online, beating distribution in physical channels state-to-state.
- Recent FDA and DEA actions have specifically centered on 7-OH products, highlighting a greater regulatory focus on the more concentrated derivatives of this product than on preliminary Kratom.
Market Overview
The market value of kratom is projected to reach USD 4.42 billion in 2026, while the growth rate is 14.15% CAGR through 2035. Botanical supply is centralized in Southeast Asia; increasing consumer demand, the presence of brand products, and growing retail and internet travel marketing prospects determine the market's shape. It is gradually stepping away from the traditional loose powder form into a range of formats that include capsules and extracts. Also, industry companies are increasingly concentrating on product quality, supply, brand, and direct-to-consumer sales.
Furthermore, the market is subject to fast-changing standards and is one of the most uncertain factors in its establishment. This report distinguishes the general commercial/companies intelligence on Kratom from the important regulatory risk factors of concentrated formulations, including the 7-OH products. Meanwhile, companies with robust supply chains, stronger quality-control measures, distribution channels, and the ability to adapt quickly to regulatory changes will be better positioned to benefit from market growth.
Key Insight: The Kratom market is worth USD 4.42 billion in 2026 and is projected to register a CAGR of 14.15% during the forecast period, though concerns regarding the regulatory risks regarding the use of using concentrated 7-OH products should be addressed separately from the overall business scenario.
Which Kratom Product Formats Have the Broadest Commercial Presence?
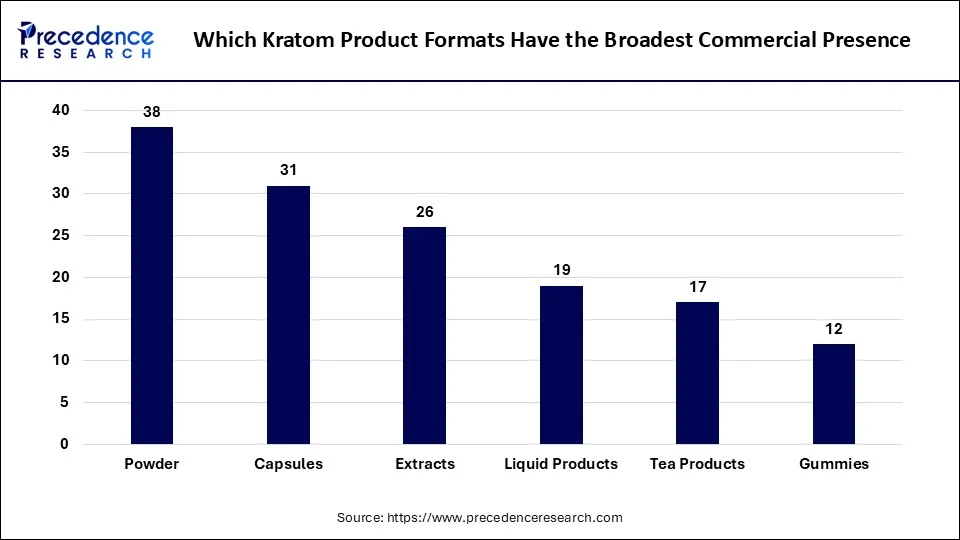
Powder is the product format with the most companies offering it (38), followed by capsule (31) and extract (26) formats. There are 19 companies that sell liquid products, 17 companies that sell tea products, and 12 companies that sell gummies. With the chasm growing as newer formats increasingly reach the gummies level, the process of powder-to-gummies development years ago proved adequate for formats that established the shelf life. It all takes waiting and watching to see if further innovation in the formats can close that gap.
Key insight: Newer formats lag the original category, which is most commonly sold in powder form at almost three times the number of companies 38 compared to gummies with 12, showing that product format still dominates the category.
Source: Precedence Research Database
Which Countries Have the Largest Estimated Commercial Kratom Supply Presence?
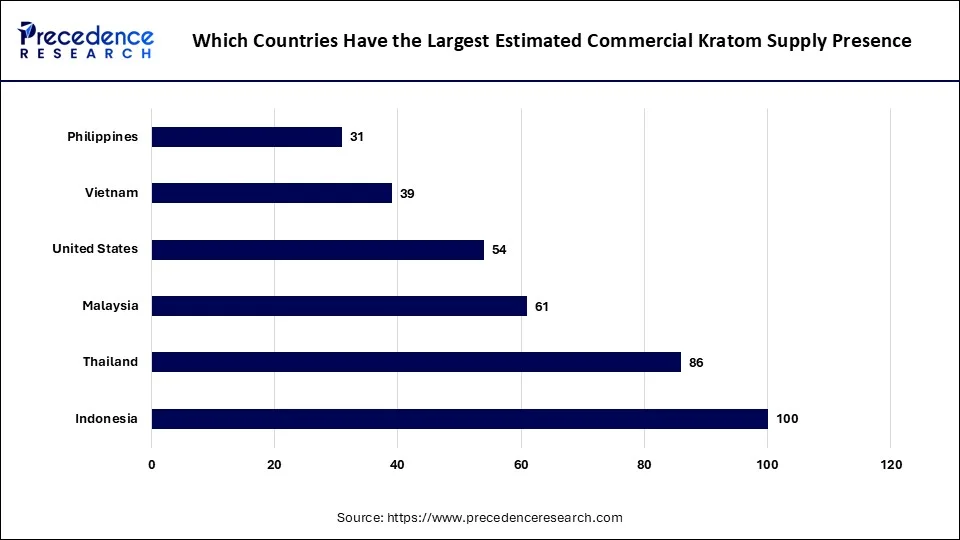
Indonesia is the country that establishes 100 as a benchmark. Thailand has a score of 86, and Malaysia is 61. Even though it does not refer to raw botanical production around the world, the standard used by the U.S. (54) is higher than Vietnam (39) and the Philippines (31). With its dominant position, Indonesia is in keeping with the experience of being the main exporter of the raw portions of the kratom leaf into the worldwide supply chain.
While Thailand's secure second-place strength was in keeping with a favorable climate and a decent tradition of exporting the same in the same geographic area. Note that the US is relatively highly rated even though the plant is not cultivated commercially at scale in the country. This reflects the proportion of the industry's value in processing, branding, and distribution, rather than in sourcing raw materials.
Key Insight: In the supply index, Indonesia tops the list at 100, whereas other nations such as the U.S. scored lower. Due not so much to their volume coming from the countries where they are cultivated, but much more to how they are processed and distributed.
Source: Precedence Research Database
How Is the Kratom Commercial Supply Chain Distributed Across Major Business Stages?
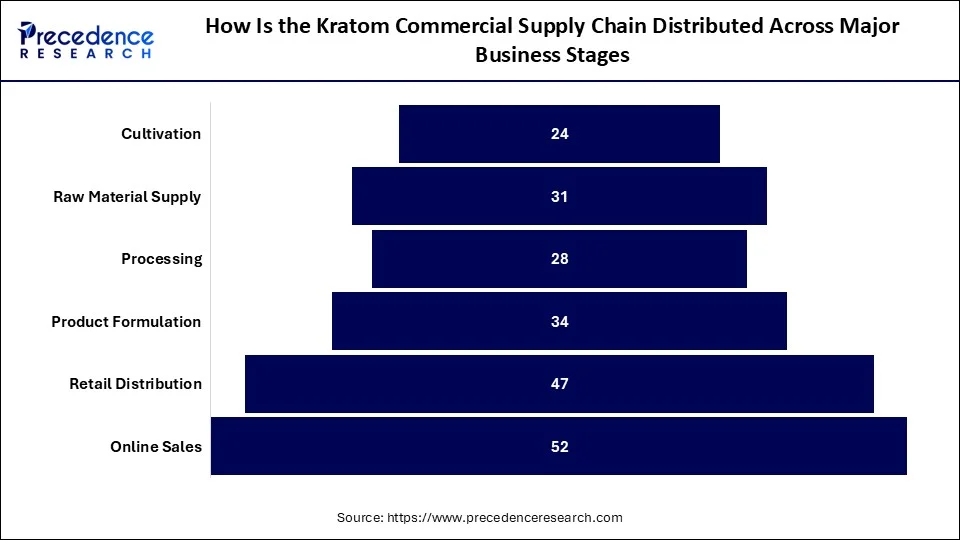
Online sales is the biggest link in the supply chain for 52 companies, compared with retail distribution, at 47. The next most populous step in product formulation is raw material supply, with 31 companies behind it, followed by processing at 28 companies and cultivation at 24, the least populous. The pattern of distribution is a typical downstream pattern, with there being significantly more companies in the distribution/retrading phase than in the cultivation or processing phase, which depends on first-budding farmers. That trend typically indicates that the retail side of the industry has less access to capital and less specialized access than cultivation and acquiring raw material.
Key Insight: The difference is that participation in lead supply chains is 52 companies to 24 companies involved in cultivation, a downstream hotspot that demonstrates the reduced barriers to entry in retail versus upfront in sourcing.
Source: Precedence Research Database
Which Sales Channels Generate the Broadest Kratom Product Availability?
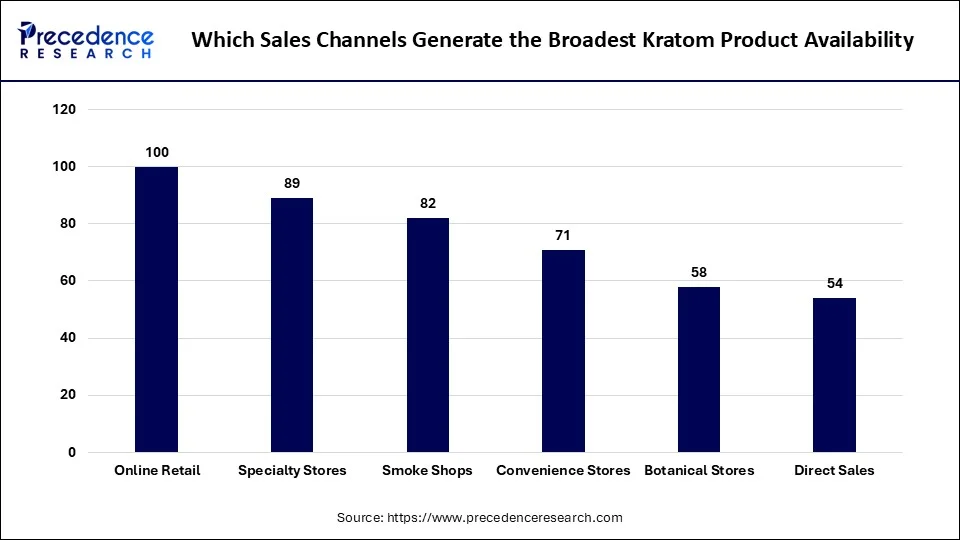
Specialty stores aren't far behind, with availability of 89, compared to smoke shops at 82 and online retail at 100. Convenience stores have 71; botanical stores, 58; and direct sales, 54. The FDA itself has reported the presence of products containing kratom online and also in retail stores throughout the U.S. This corroborates the wide availability seen in this index. The fact that online retail has a clear advantage over all other physical stores stems from the format's capability to reach consumers, even when retail is heavily regulated in certain states but not in others.
Key Insight: Online retail comes in with a big lead in the availability race, with 100% topping all other physical channels, an advantage acknowledged by the FDA based on the uneven availability of kratom in the various states involved.
Source: Precedence Research Database
How Many Major Kratom Product Categories Are Used in Commercial Portfolios?
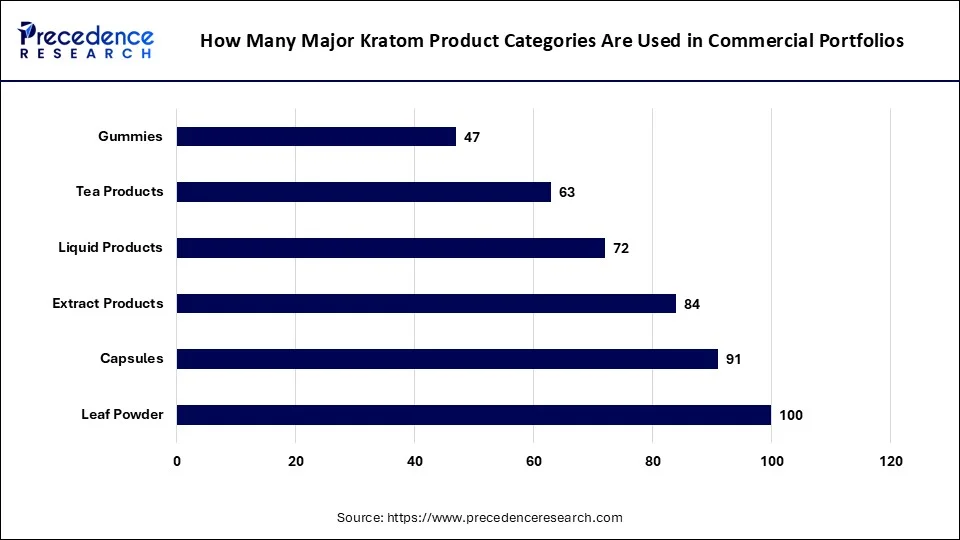
The category portfolio's leaf powder index is sustaining the 100 benchmark, while capsules and extract products are at 91 and 84, respectively. Liquid products are at 72, tea products at 63, and gummies at 47, the rarest in many commercial portfolios. This index is similar to the product format company count data previously discussed.
But reflects the same product format that companies choose to produce, which has the most coverage within each company's portfolio. The presence of gummies at the very bottom of both measures signals that the format has real obstacles to progress. Due to kratom's flavor and dosage variability, formats have taken care of in an earlier day powder and capsules.
Key Insight: Leaf powder is ranked 1 on the product-category index, closely followed by the previously mentioned company-count data, and both demonstrate that gummies are still the least-developed product category.
Source: Precedence Research Database
How Has U.S. Regulatory Activity Increased Across Kratom-Related Products?
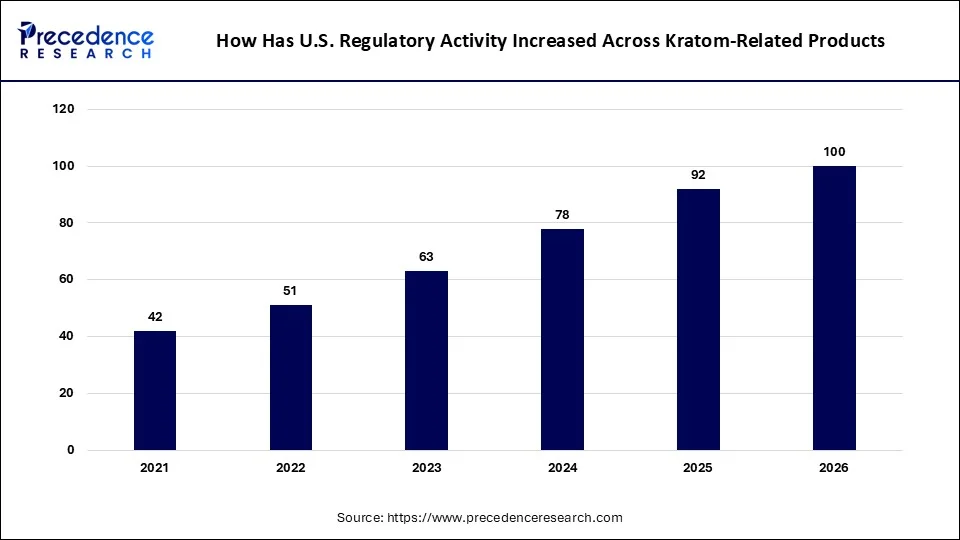
Regulatory activity has climbed steadily on this index, from 42 in 2021 to 51 in 2022, 63 in 2023, 78 in 2024, 92 in 2025, and a projected 100 in 2026. This is more than a doubling of regulatory activity over 5 years. The FDA has sent a series of warning letters on concentrated 7-OH products in 2025. The DEA has taken action on 7-OH products exceeding a proposed threshold and related substances in 2026. The continued rise of this index is coupled with real legislative steps taken by the Federal government in both 2025 and 2026. This reflects a shift in regulatory focus from natural kratom leaf to concentrated 7-OH products.
Key Insight: Regulatory activity more than doubled from an index of 42 in 2021 to 92 in 2025, with the FDA's 2025 warning letters and DEA's 2026 action both concentrated specifically on 7-OH products rather than natural kratom leaf.
Source: Precedence Research Database
What Percentage of Natural Kratom Alkaloid Content Can Be Attributed to 7-OH?
| Natural 7-OH | Other Alkaloid Content |
| 2 | 98 |
7-OH exists in the leaves of natural kratom in less than 2% of the total alkaloids. The remaining 98% is made up of other alkaloids that are naturally occurring as well, the FDA says. The distinction is an important one for an understanding of the activity of the regulations referred to in the table above. The products vulnerable to warning letters and enforcement action tend to be 7-OH formulations added to the leaf (as opposed to the leaf itself).
Aman interpreted, in popular terms, that kratom can be used for the two overall products, natural botanical kratom and highly concentrated 7-OH, classified as distinct commercial and regulatory categories and not the same thing. To misrepresent the current regulatory threat in the natural leaf market would be to group products manufactured by company A with those manufactured by company B, only for company B to be the whites of their eyes.
Key Insight: According to the FDA, the natural leaf product (also known as Kratom) contains less than 2% of the alkaloid 7-OH than do the concentrated extract products containing the same alkaloid, so these are natural ingredients with a different regulatory category.
Source: Precedence Research Database
How Many Americans Reported Kratom Use in National Survey Data?
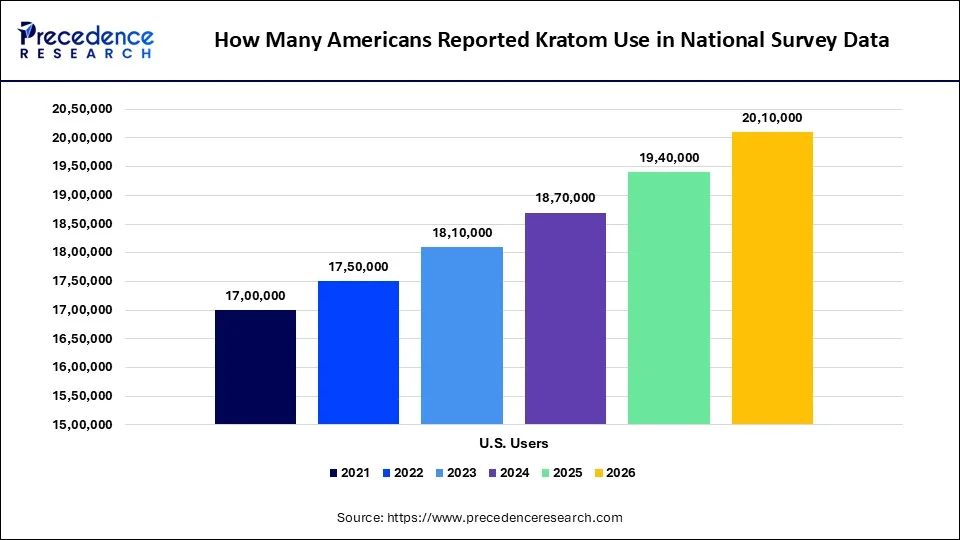
Reported U.S. kratom users climbed from 1,700,000 in 2021 to 1,750,000 in 2022, 1,810,000 in 2023, 1,870,000 in 2024, 1,940,000 in 2025, and a projected 2,010,000 in 2026. The 2021 figure is based on the national-use estimate cited by the FDA, while later figures are analyst estimates rather than government-reported usage statistics, a distinction worth keeping in mind when comparing years directly.
The increase for this period has been steady, but not dramatic, with an average of approximately 3.5% growth each year. There is no evidence of a one-off event having resulted in the sudden increase in reporting. The consumer-use trend should not be considered as a measure of product safety or legal status, but rather as an indicator of the potential commercial demand base of the market.
Key Insight: Reported U.S. individuals who use kratom increased at a steady rate between 2021 and 2026 (1.7 million in 2021, and 2.01 million projected in 2026), but the source for 2021 is an FDA-cited estimate, while 2021 and more recent years are estimated by analysts.
Source: Precedence Research Database
Buyer Intelligence
Which Consumer Buying Channels Have the Greatest Influence on Kratom Product Purchases?
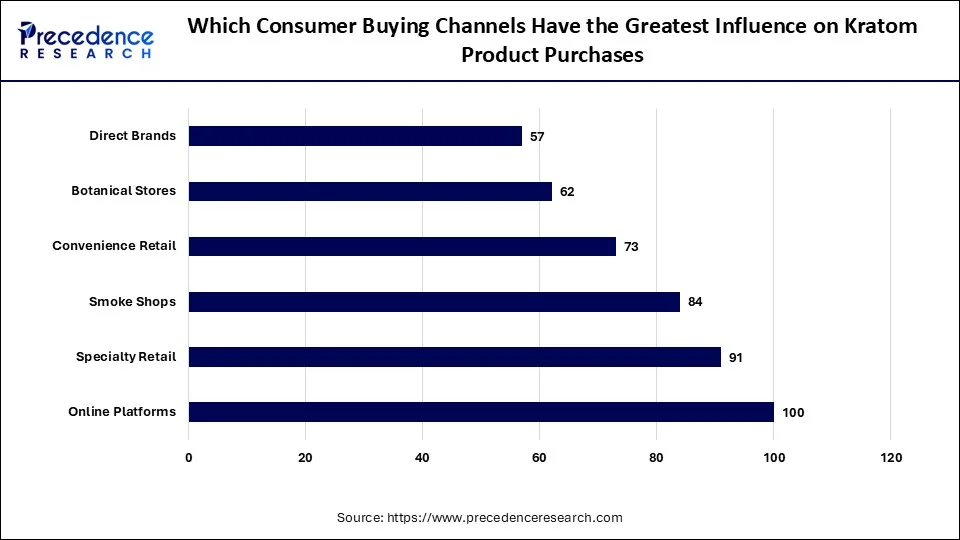
Online places the window for the shopper to influence the purchase at 100, ahead of specialty retail (91) and smoke shops (84). Multiples, convenience retail and botanical retail stand at 73, 62 and 57 respectively, whilst direct brands are at 57 on the buyer index. This ranking is in line with the earlier availability data gathered on sales channels, confirming that the most available sales channels are also the ones that have the most influence on consumers' purchasing behavior. That overlap indicates that the force driving the actual location of the majority of consumption of Kratom is availability rather than brand loyalty or the specific price per channel.
Key Insight: This means that platforms are as influential on buyers as sales channels are available; availability is more impactful on purchasing than brand loyalty.
Source: Precedence Research Database
What Factors Influence Commercial Kratom Product Selection?
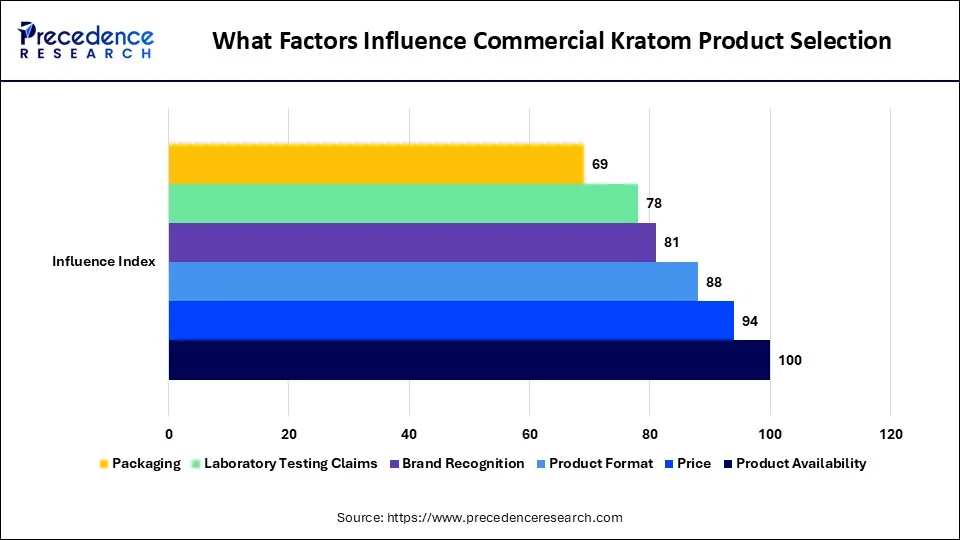
Product availability is ranked as the highest-ranking selection factor at 100, followed by price at 94 and product format at 88. Only the least influential measured factor, brand recognition, scored less than 81 (78), while laboratory testing and packaging ranked at 69 and 62, respectively. The degree of product-quality verification that consumers expect is shifting, with laboratory testing results as high as 78 points on the grid.
This shift is likely to be connected to the regulatory focus on product quality mentioned earlier in this analysis, as it can be found in levels of product-quality verification in consumer expectations. Testing and verification claims might continue to rise on this list in relation to price and format as enforcement continues to ramp up regarding concentrated products. This cites a lack of documented product quality increases in value, particularly for those toying with the idea of purchasing a product in the face of an evolving regulatory environment.
Key Insight: With 100 leading selection factors, you can see key product availability factors are gaining importance by the day, given that regulatory scrutiny is growing and quality verification is gaining significant importance.
Source: Precedence Research Database
Which Buyer Segments Create the Broadest Commercial Demand for Kratom Products?
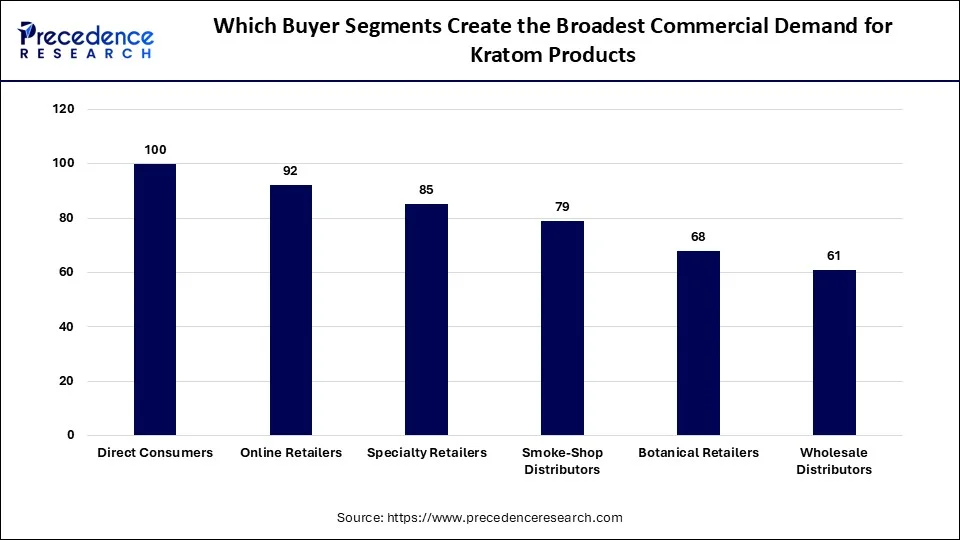
Consumers' demand index for the buyer-segment market is 100, higher than the 92 for online retailers and 85 for specialty retailers. The smallest demand segment, measured by the number of retailers registered, is the smoke shop distributors at 79, followed by the botanical retailers at 68 and the wholesale distributors at 61. This index is appropriate since there are more individual decisions made in this market segment than institutional or bulk decisions. Aditi believes in the absence of the type of wholesale mergers that have swept more established markets for consumer goods. The market is fragmented at the retail level, with wholesale distributors on the bottom line.
Key Insight: Buyer-segment demand is led by direct consumers at 100, and behind them come wholesale distributors at 61, still indicating that this market is not tribalized by going on a buying frenzy to consolidate buyers.
Source: Precedence Research Database
Segmentation Analysis
By Product Type
The kratom powder segment maintains its top position with 38.65% market share, gaining from updated options, at an 11.85% CAGR, which is the slowest of the six, as it has proven to hold a loyal customer base over time. The market share of kratom capsules/tables sits at 21.40%, expanding at a 14.60% CAGR, and kratom tinctures dropped from 9.85% to 9.20% at a 13.35% CAGR.
Product innovation will continue to broaden what kratom extracts can offer, resulting in their impressive growth in market share (18.75% to 24.80%) and CAGR (17.95%) as the fastest-growing product type. Kratom beverages come in second, with market shares increasing from 7.20% to 9.45% at a 17.20% CAGR, whereas other products' market shares decreased at the slowest growth rate listed, 6.85% CAGR, from 4.15% to 2.00%.
Key Insight: The kratom extracts segment will be the second-largest product after powder by 2035, with Capsules dropping to 31.20% share and the Kratom extracts segment growing at over 17.95% CAGR.
By Form
Processed kratom occupies the major share of the market in this split, rising from 71.85% to 76.40% of the market, while raw Kratom leaves slowly slide to a 23.60% share in the market at 11.45% CAGR because one processing partner can serve several market-ready products simultaneously in powders, capsules, extracts, and tinctures. Rather than being confined to one product line, the commercial demand for processed products holds a bigger share and is growing faster. That flexibility gives processed-form manufacturers a meaningfully broader path to portfolio expansion than raw-leaf sellers, who remain tied to a single, less differentiated product.
Key Insight: Processed kratom will grow from 71.85% to 76.40% market share, showing a higher CAGR of 15.05%, and maintaining its dominance over raw leaves, with an increasing number of consumer-friendly formats available, such as extracts and beverages, due to the availability of a crushing mill.
By Application
The top application is pain management, with a market share of 31.45% in 2026, dropping to 29.10% by 2035, with a CAGR of 13.30%. Energy and focus holds at 24.20% market share, growing to 25.60% at a 14.75% CAGR, and mood enhancement grows from 19.35% to 20.25% market share at a 14.65% CAGR.
The only application to see such a large increase is the relaxation and sleep segment, which grew from 15.10% to 16.45% market share at a 15.20% CAGR. The highest rate of any named application, while the other applications, at the slowest CAGR of 12.15%, shrunk from 9.90% to 8.60% market share. I believe, as they're sorted by consumer-reported use categories, and as no use category is a confirmed medical indication, it's important to note.
Key Insight: Relaxation and sleep grow fastest of any reported application at a 15.20% CAGR, though these categories reflect consumer-reported use rather than established medical indications.
By Distribution Channel
Online retail leads in distribution by a wide margin, growing from 46.35% to 51.80% market share at a 15.85% CAGR, the fastest of any channel and the only one crossing the halfway mark of total share. Specialty stores are in the process of decreasing, dropping from 21.80% to 20.25% market share at a 13.35% CAGR, followed by smoke shops at a 10.55% CAGR, down through the table to 12.40%.
The market share of herbal medicine stores is increasing at a modest rate of 14.65% CAGR from 10.40% to 10.85%, whereas the market share of other channels is declining at a rate of 9.45% CAGR in the range of 6.20% to 4.70%. Aman mentioned that the lead for online retail was also held in the availability and buyer-influence indices. Its continued growth indicates that there will be further relative market share retaken by online retail versus in-store, as more consumers will take the route to an online purchase over in-store in the end.
Key Insight: Online retail moves fastest of all distribution channels at 15.85% CAGR and by 2035 has overtaken offline retail with the highest share of market (51.80%).
By Region
North America accounts for the largest share of the region with a 43.25% market share in 2026, but is the region where the slowest rate of decline is projected (13.10% CAGR), which slows to 39.10% in 2035. Europe holds an 18.65% market share, growing to 19.40% at a 14.65% CAGR, and Latin America grows modestly from 7.80% to 7.95% market share at a 14.35% CAGR. The smallest region, the Middle East and Africa, recorded a decrease in market share from 5.90% to 5.70% with a CAGR of 13.75%. Asia Pacific region shows the highest growth in the market with a compound annual growth rate of 15.75%, up from 24.40% market share, reflecting the region's position as the major source of botanical supply.
Key insight: Asia Pacific accounts for the highest growth rate in the region, expanding at a CAGR of 15.75%, which will allow it to dominate the market by 2035 with 27.85%, whereas North America loses the most market share as it is the largest market.
Source: Precedence Research Database
Expert Insights
- The botanical products market for kratom is becoming increasingly segmented with the emergence of a more organized consumer wellness business. This is driven by product standards, quality assurance, conscious sourcing, and evolving regulatory requirements. The most interesting prospects will be along the lines where quality control is improved, product development is based on scientific principles, and the raw materials are reliably provided.
- I believe product interest is increasing in plant-based wellness products and convenient formats. This will continue to be a factor in market competitiveness over the next decade. Few companies are fully equipped to handle the transition from a traditional powder to capsules, tablets, extracts, and other formulated shots. But those are opening the door for new product opportunities.
- One of the industry's biggest challenges will continue to be regulatory uncertainty. As the market becomes more formal, companies that can evolve their practices in line with regulations, create efficient testing systems, track their supply chains, and adopt responsible manufacturing will have an advantage, with consumers more focused on the convenience, consistency, and transparency of the offerings. I am predicting even more consumers will bring up further requests for differentiated formulations and professionally packaged kratom products.
Our Experts
Deepa Pandey carried out extensive primary research, formulated and interpreted the methodology, segmented the market, considered consumer behavior, and analyzed regional developments, competitive scenario, and forecast, which laid the foundation for the analytical part of the report.
Aman gathered and cross-checked all regulatory and company data, various trading and supply-chain markers, pricing data, and other quantitative data independently collected, thereby enriching the evidence base behind the market estimations.
Aditi read and checked the entire research report, validated research, streamlined the documentation, corrected any inconsistencies, and completed the final research report, ensuring clear and accurate analytical work.
Kratom Market Segments
By Product Type
- Kratom Powder
- Kratom Capsules & Tablets
- Kratom Extracts
- Kratom Tinctures
- Kratom Beverages
- Other Products
By Form
- Processed Kratom
- Raw Kratom Leaves
By Application
- Pain Management
- Energy & Focus
- Mood Enhancement
- Relaxation & Sleep
- Other Applications
By Distribution Channel
- Online Retail
- Specialty Stores
- Smoke Shops
- Herbal Medicine Stores
- Other Channels
By Region
- North America
- Asia Pacific
- Europe
- Latin America
- Middle East & Africa
Questions This Report Deliberately Leaves Open
- What will the size of the global kratom market be by 2030 and 2035, and what will the market's estimated growth rate imply for companies looking at investments for the long-term?
- What does this increase in the regulatory-activity index from 42 for 2021 to 100 in 2026 mean for companies planning to conduct multi-year product and distribution strategies?
- What implications does the FDA's stance that kratom cannot or does not meet its definition of a drug, food additive, or dietary supplement have on businesses selling it in online and specialty retail outlets?
- How to be sure that companies are distinguishing between natural botanical kratom and big-ag concentrated 7-OH products, especially if the FDA indicated that 7-OH is less than 2% of the total alkaloids in natural kratom?
- How might the DEA's proposed 2026 action, if it gets approved, affect 7-OH above a proposed certain threshold, perhaps very much on product formulation and the wider kratom industry?
- What is causing the Growth of Kratom Extracts at 17.95% CAGR and Kratom Beverages at 17.20% CAGR, and what advantage does this offer when regulations are taking a harder look at concentrated products?
- How exposed is Online Retail, which holds a 46.35% share and is projected to reach 51.80%, to platform policy changes and payment-processor restrictions given kratom's regulatory status?
- What does Indonesia's supply index of 100, compared with Thailand's 86, reveal about supply-chain concentration and sourcing risks across the global kratom industry?
- When considering confidence in market size, businesses should treat 1.7 million kratom users in the U.S., as cited by the FDA, as compared to 2.01 million estimated by the analyst; how many?
- Given the fact that the market share of Asia Pacific is projected to increase from 24.40% to 27.85% in the medium term, with a CAGR of 15.75%, while North
- America has the highest market share of 43.25% but is decreasing its share relative to the Asian market, which market is to consider for medium-term investments?
- What are the implications of the application categories of Pain Management, Energy & Focus, Mood Enhancement, and Relaxation & Sleep, if these are the application areas that users report using for, but not medical indications?
- How important will Laboratory Testing Claims, with an influence index of 78, become as a competitive differentiator while scrutiny of kratom product composition continues to increase?
- What does the number of companies operating at the retail and online-sales stages 52 in retail and 47 in online sales compared with 24 in cultivation and 31 in raw-material supply reveal about supply-chain concentration?
- What are companies starting to do as the regulatory-activity index gets higher, especially for concentrated 7-OH products and not for natural kratom products in general?
- How should smoke shops, which hold a 15.25% share and are growing at the slowest major-channel CAGR of 10.55%, respond as online retail and herbal medicine stores gain relative market share?
References
Precedence Research Database
Kratom Market - Size, Share, Company, Product, Buyer Intelligence, and Segmentation Data
Data used: Market size, CAGR, all supply-chain/regulatory/buyer intelligence tables, and all segment share/CAGR tables presented throughout this report.
U.S. Food and Drug Administration
For inquiries regarding discounts, bulk purchases, or customization requests, please contact us at sales@precedenceresearch.com
Frequently Asked Questions





Ask For Sample
No cookie-cutter, only authentic analysis – take the 1st step to become a Precedence Research client
 Get a Sample
.webp)



 sales@precedenceresearch.com
 Schedule a Meeting