Sand Screen Market Size, Key Companies, Company Market Share, Power Generation Capacity, Energy Consumption, Pricing Trends, Investment Analysis, Competitive Positioning, and Demand Forecast
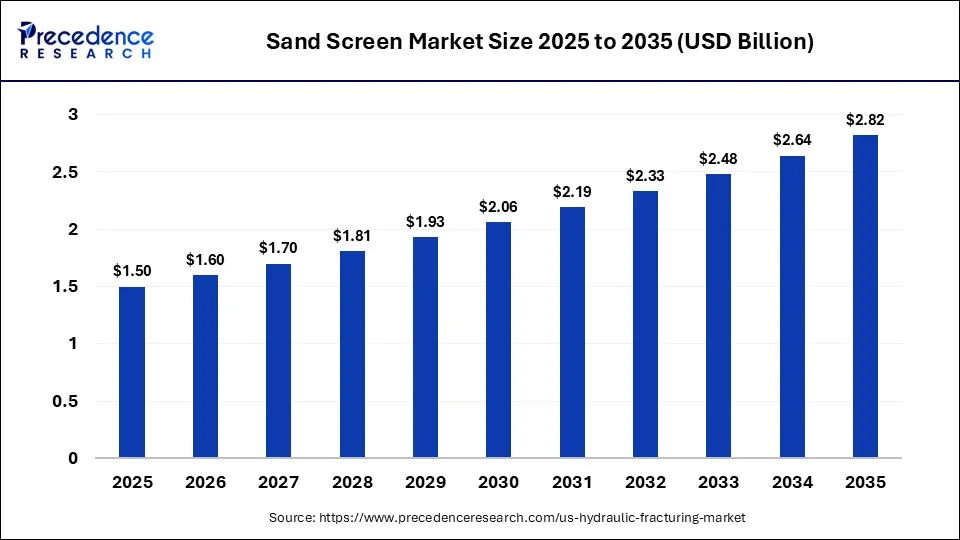
The sand screen market was valued at USD 1.60 billion in 2026, expanding at a CAGR of 6.5% by 2035. The market growth is driven by increasing oil and gas exploration, rising demand for effective sand-control solutions, and growing completion activity in challenging reservoirs. Increasing offshore drilling, unconventional reservoir development, and focus on well productivity and lifecycle economics are expected to support market expansion through 2035.
Source: https://www.precedenceresearch.com/sand-screen-market
 Get a Sample
 Table Of Content


Sand Screen Market Size, Share, Trends, and Forecast Analysis 2035
The sand screen market is forecasted to expand from USD 1.60 billion in 2026 to USD 2.82 billion by 2035, growing at a CAGR of 6.5% from 2026 to 2035. The market is a specialized, engineering-led segment of the broader sand-control industry, with demand increasingly influenced by well architecture, formation characteristics, sand size, production rates, completion methods, and intervention economics. Stand-alone screens account for approximately 65% of 2025 demand, while land-based wells represent roughly 70%, highlighting the continued importance of conventional and unconventional onshore completions.
Key Takeaways
- The global sand screen market is estimated at approximately USD 1.60 billion in 2026 and is projected to reach about USD 2.82 billion by 2035, representing a 6.5% CAGR.
- Stand-alone sand screens accounted for approximately 65% of 2025 demand, highlighting their importance in sand-control completions.
- Land-based wells represented roughly 70% of demand, demonstrating the continued importance of onshore completions.
- Wire-wrapped screens accounted for approximately 29% of 2025 revenue among broader sand-control screen estimates, making them a leading technology.
- A broader sand-control market estimate placed 2025 spending above USD 1.50 billion, including gravel-pack systems, completion services, and other sand-management equipment.
- The sand screen market is expected to expand by approximately USD 1.22 billion between 2026 and 2035, based on the stated 2026 and 2035 market values.
- North America remains a major demand center, while deepwater developments in Latin America, offshore Middle East and Africa, and technically demanding Asia Pacific reservoirs support premium-screen demand.
- The market is expected to grow at approximately 6.5% CAGR from 2025 to 2035, supported by horizontal wells, mature-reservoir sand management, deepwater development, and longer-life completion equipment.
- Global annual demand is shaped by well complexity, formation characteristics, production rates, sand-size distribution, completion methodology, and intervention economics rather than drilling activity alone.
- The market comprises 22 leading companies, spanning integrated oilfield-service providers, specialist screen manufacturers, and regional completion-equipment suppliers.
Sand Screens Are a Specialized, Engineering-Led Downhole Market Where Well Complexity Is Expanding the Premium Revenue Pool
The global sand screen market is estimated at approximately USD 1.60 billion in 2026 and is projected to reach about USD 2.82 billion by 2035, representing approximately 6.5% CAGR and an incremental revenue opportunity of roughly over the period. Available market estimates place stand-alone sand screens at approximately 65% of 2025 demand, while land-based wells account for roughly 70%, highlighting the continued importance of conventional and unconventional onshore completions.
The market is structurally different from the broader sand-control systems market. Broader system estimates place 2025 spending above USD 1.50 billion, because they include gravel-pack systems, completion services, and other sand-management equipment in addition to screens. This distinction is critical when sizing the addressable market for screen manufacturers and component suppliers.
Demand is increasingly determined by well architecture, formation characteristics, production rate, sand size distribution, completion methodology, and intervention economics, rather than simply by drilling activity. Wire-wrapped, premium mesh, pre-packed, slotted and expandable/conformable screen technologies compete across open-hole, cased-hole, stand-alone, gravel-pack and remedial completions.
North America remains a major demand center, while deepwater developments in Latin America, offshore Middle East and Africa, and technically demanding reservoirs in Asia Pacific create disproportionate demand for premium screens.
Key Coverage
- USD 1.50 billion estimated 2025 market
- USD 2.82 billion projected 2035 market
- 6.5% 2025-2035 CAGR
- Technology segmentation by wire-wrap, mesh, pre-pack, slotted and expandable/conformable designs
- Market boundary analysis separating screens from broader sand-control systems
Market Size & Forecast - Growth Is Being Driven More by Screen Intensity per Well Than by Well Count Alone
The market increased from approximately USD 1.50 billion in 2025 to USD 1.60 million in 2026 under one market boundary, while another screen-specific estimate places 2025 demand at approximately USD 2.82 billion. The difference illustrates the importance of defining whether the market includes only downhole sand screens or selected adjacent screen or sand-control systems.
The base-case outlook points toward approximately USD 2.82 billion by 2035, with growth supported by higher horizontal-well exposure, mature-reservoir sand management, deepwater development and demand for longer-life completion equipment. The report models base, upside and downside scenarios using drilling or completion activity, offshore capital expenditure, well complexity, screen penetration and technology mix.
Key Coverage
- 2026-2035 historical and forecast market values
- Revenue and unit-equivalent demand
- CAGR and incremental opportunity
- Onshore/offshore contribution
- New-well versus remedial demand
- Scenario modelling
- Country-level forecasts
- Screen revenue per completed well
Segmentation Analysis - Wire-Wrapped Screens Retain Scale While Premium Technologies Capture High-Value Applications
Wire-wrapped screens remain the foundational technology because of their established manufacturing base, precise slot control, high open area, and compatibility with gravel-pack and stand-alone completions. Broader sand-control screen estimates place wire-wrapped screens at approximately 29% of 2025 revenue, ahead of expandable, mesh, and slotted configurations.
Premium mesh technologies occupy a smaller volume pool but command higher engineering value in fine-sand, high-rate, deepwater, and mechanically demanding wells. Expandable screens similarly compete through reduced annular gaps, improved wellbore compliance and deployment advantages.
The full segmentation model evaluates technology, completion type, application, well geometry, well depth, material, screen configuration, sand size, operator type and geography, identifying both revenue-leading and fastest-expanding niches.
Key Coverage
- Wire-wrapped, mesh, pre-packed, slotted and expandable screens
- Stand-alone versus gravel-pack
- Open-hole versus cased-hole
- Onshore versus offshore
- Oil, gas, injection and remedial applications
- Horizontal, vertical, deviated and multilateral wells
- Stainless steel versus higher-alloy materials
Market Dynamics - Reservoir Complexity is Increasing the Value of Precision Filtration and Erosion Resistance
The principal growth driver is the rising economic penalty associated with uncontrolled sand production. Sand can damage completion equipment, tubing and surface facilities and can trigger production losses or intervention requirements. Screen design therefore increasingly focuses on erosion resistance, plugging resistance, collapse strength, tensile performance and flow distribution.
The principal restraints include high qualification requirements, operator conservatism, long procurement cycles, commodity-price-driven upstream capex and the fact that screens are often embedded within larger completion packages.
Key Coverage
- Sand-production risk
- Horizontal and extended-reach wells
- Deepwater and HPHT requirements
- Mature-field intervention demand
- Commodity-price sensitivity
- Qualification and switching barriers
- Premiumization opportunities
Tentative Leading Company Universe - 22 Companies Shaping the Sand Screen Competitive Environment
| Company | Headquarters | Market Position | Core Strength | Major Applications/Segments |
| SLB | USA | Global integrated leader | Advanced sand-control systems | Deepwater, HPHT, horizontal |
| Halliburton | USA | Global integrated leader | Screen and completion integration | Gravel pack, expandable, offshore |
| Baker Hughes | USA | Global integrated leader | Broad screen portfolio | Openhole, gravel-pack, offshore |
| Weatherford | USA | Global completion provider | Conventional and expandable screens | Oil & gas completions |
| NOV | USA | Global equipment supplier | Completion equipment | Downhole/completion systems |
| 3M | USA | Technology specialist | Ceramic filtration | High-rate, erosive wells |
| Johnson Screens / Aqseptence | USA/Germany | Specialist screen leader | Wire-wrap and premium screens | Oil & gas, water |
| Completion Products | Singapore | Specialist challenger | Direct-wrap and premium screens | Deepwater, SAGD |
| Tendeka | UK | Completion technology specialist | Sand-control and inflow control | Complex completions |
| Packers Plus | Canada | Completion specialist | Integrated sandface systems | Horizontal/onshore/offshore |
| Delta Screens | USA | Specialist manufacturer | Custom premium screens | Heavy oil, HPHT, deepwater |
| CP Screens / Completion Products | Singapore | Specialist manufacturer | Premium/direct-wrap | Sand-control completions |
| Exceed Canada | Canada | Regional specialist | Composite and wire-wrap screens | Heavy oil |
| Apollo Screens | India | Regional manufacturer | Wedge-wire screens | Oil, gas, water, geothermal |
| GKD Group | Germany | Filtration specialist | Metal mesh filtration | Premium filtration |
| Varel Energy Solutions | USA | Oilfield equipment specialist | Completion components | Downhole applications |
| Mitchell Industries | USA | Specialist supplier | Sand-control equipment | Oilfield completions |
| Banpong Screen Pipe | Thailand | Regional specialist | Screen pipe fabrication | Oil & gas/water |
| Porous Metal Filters | USA | Technology specialist | Advanced porous media | Premium filtration |
| Welltec | Denmark | Completion technology specialist | Intervention/completion technology | Complex wells |
| Jereh | China | Regional integrated provider | Oilfield equipment | China/international |
| TAM International | USA | Completion specialist | Packers/ICD/sand-control integration | Reservoir optimization |
How is Competition in the Sand Screen Market Evolving Between Integrated Completion Providers and Specialized Screen Manufacturers?
The global sand screen market is characterized by a hybrid competitive structure, combining large integrated oilfield-service providers with specialist screen manufacturers and regional completion-equipment suppliers. Integrated providers compete through bundled completion offerings, operator relationships and the ability to combine screens with gravel-pack, inflow-control and well-completion technologies, while specialists differentiate through screen architecture, filtration performance, metallurgy, customization and manufacturing responsiveness. Our analysis indicates that this structure creates different competitive battlegrounds by application: standardized onshore completions remain more scale- and cost-sensitive, whereas deepwater, heavy-oil, fine-sand and high-rate wells place greater weight on engineering capability and lifecycle performance.
Our assessment is that technology differentiation is becoming more important than simple product availability, particularly as horizontal, extended-reach and technically complex wells increase the consequences of screen failure. Competition is shifting toward wire-wrapped and premium mesh designs with tighter filtration control, erosion-resistant architectures, expandable/conformable screens and specialized materials. The approximately USD 1.50 billion global market estimated for 2025 provides a relatively focused revenue pool, meaning that even modest share gains in premium applications can materially affect supplier economics. We believe this favors companies capable of combining screen manufacturing precision, reservoir-specific engineering, and broader completion integration, while creating opportunities for specialists that can solve narrowly defined technical problems better than larger generalist suppliers.
In our view, the most significant strategic implication is that competitive advantage will increasingly depend on value captured per completed well rather than screen volume alone. Suppliers with access to deepwater, HPHT, heavy-oil and long-horizontal projects can potentially command higher-value business because customers place greater emphasis on erosion resistance, collapse strength, sand-retention performance, deployment reliability and reduced intervention risk. Conversely, regional manufacturers can compete where shorter lead times, localization, customization and cost efficiency outweigh the benefits of a globally integrated completion package. This creates a market in which scale, technology leadership, application specialization and geographic proximity represent distinct competitive strategies rather than a single hierarchy of advantage.
Which Company Capabilities and Strategic Positions Are Shaping Competitive Advantage in the Sand Screen Market?
The sand screen market comprises a mix of integrated oilfield-service providers, specialist sand-control manufacturers, and regional completion-equipment companies, with competitive differentiation increasingly extending beyond product availability into screen architecture, metallurgy, manufacturing precision, application engineering, and completion-system integration. Our analysis indicates that companies with broader completion portfolios can leverage cross-selling and integrated well-design capabilities, while specialized manufacturers can differentiate through filtration performance, erosion resistance, customization, rapid engineering support, and responsiveness to reservoir-specific requirements. Competitive relevance therefore varies significantly by application, with standardized land-based projects placing greater emphasis on cost and lead time, while deepwater, high-rate, heavy-oil, fine-sand, and complex horizontal wells place greater value on technical performance and deployment reliability.
Our analysis indicates that the most meaningful company-level differentiation is shifting toward the ability to solve specific well-performance challenges rather than simply supply conventional screens. Product breadth, proprietary screen designs, advanced materials, expandable or conformable architectures, premium mesh and wire-wrapped technologies, manufacturing capabilities, testing infrastructure, geographic footprint, and customer relationships increasingly determine the depth of competitive positioning. Our assessment is that companies combining engineering expertise with manufacturing control and broader completion capabilities are positioned to address a larger portion of the value chain, whereas focused specialists can remain highly competitive where operators prioritize technical customization or niche sand-control requirements.
In our view, company profiles are most valuable when evaluated through comparable operating and strategic metrics rather than corporate descriptions alone. The report therefore assesses leading participants across estimated sand-screen revenue exposure, product portfolio breadth, technology architecture, application penetration, geographic presence, manufacturing footprint, disclosed capacity, R&D and innovation activity, strategic partnerships, customer reach, and recent portfolio developments. This approach highlights where competitive strength is derived from scale, technology, specialization, localization, or integrated completion capabilities, while identifying capability gaps and areas where market participants are competing for the same high-value applications.
Which Companies Hold the Strongest Competitive Positions in the Sand Screen Market, and Where Is Market Share Most Contested?
The global sand screen market is estimated at approximately USD 1.60 billion in 2025 and is projected to reach about USD 2.82 billion by 2035, representing a 6.5% CAGR and an incremental market opportunity of roughly. Competition is fragmented across integrated oilfield-service providers, specialist screen manufacturers, and regional completion-equipment suppliers, with competitive intensity varying substantially by product architecture, application, and geography. Market share is therefore not determined solely by shipment scale; exposure to premium deepwater, high-rate, heavy-oil, fine-sand, and complex horizontal-well applications can materially influence company revenue contribution and strategic positioning.
Our analysis indicates that competitive ranking in this market should be assessed through a multidimensional share framework rather than revenue alone. We evaluate participants based on estimated market share and sand-screen revenue exposure alongside product breadth, technology coverage, application penetration, geographic reach, manufacturing footprint, disclosed capacity, customer relationships, and innovation activity. Our assessment is that companies with integrated completion capabilities can capture broader project value, while specialized manufacturers may achieve stronger positions in technically differentiated niches where filtration performance, erosion resistance, customization, and deployment reliability are decisive purchasing criteria. This creates a market in which leadership can vary by application and region even where overall company rankings appear relatively stable.
In our view, the most significant competitive opportunity through 2035 is the approximately USD 2.82 billions of incremental market value, particularly where suppliers can translate technical differentiation into higher-value applications and recurring operator relationships. The report therefore distinguishes between overall market-share leadership, premium-technology positioning, regional strength, and application-specific competitive presence rather than treating market share as a single measure of advantage. This analysis identifies where share is concentrated, where challengers have room to expand, and which capability gaps could enable suppliers to capture disproportionate growth in emerging demand pockets
Which Product Portfolio Capabilities Are Creating Differentiation in the Sand Screen Market?
The sand screen market spans multiple product architectures, including wire-wrapped, direct-wrap, premium mesh, pre-packed, expandable, and other specialized screen configurations, with product selection increasingly determined by well geometry, formation characteristics, sand size, production rate, erosion exposure, and deployment conditions. Demand is therefore shifting from a largely standardized product-selection model toward application-specific screen engineering, particularly for horizontal, extended-reach, deepwater, heavy-oil, and high-rate wells. Product differentiation increasingly depends on filtration precision, collapse strength, erosion resistance, flow capacity, mechanical integrity, and deployment reliability rather than screen availability alone.
Our analysis indicates that portfolio breadth is becoming strategically important, but breadth without technical differentiation does not necessarily translate into competitive advantage. Suppliers offering multiple screen architectures can address a wider range of completion requirements, while companies with specialized technologies can compete more effectively in technically demanding niches. Our assessment is that the strongest portfolio positions are likely to combine configuration flexibility with differentiated materials, manufacturing precision, customization capability, and compatibility with broader sand-control or completion systems. This creates distinct competitive pathways: portfolio breadth supports project coverage, while specialized engineering capabilities can strengthen positioning in higher-complexity applications.
In our view, the key strategic implication is that product portfolios must increasingly be evaluated according to application coverage and technical performance rather than the number of products offered. The report benchmarks competing portfolios by screen type, construction architecture, filtration mechanism, material, operating environment, application, customization capability, and integration with completion technologies, identifying where portfolios overlap and where meaningful capability gaps remain. Particular attention is given to technologies designed to address erosion, fine-sand retention, high production rates, complex well trajectories, and challenging deployment conditions, as these factors can influence product selection and value capture.
Sand Screen Market Segments Covered in the Report
By Screen Type
- Wire-Wrapped
- Premium Mesh
- Pre-Packed
- Expandable
- Slotted Liner
- Ceramic
By Sand Control Method
- Standalone Screens
- Gravel-Pack
- Frac-Pack
- Expandable Sand Screens
By Well Type
- Horizontal
- Vertical
- Deviated
- Multilateral
By Application
- Oil Wells
- Gas Wells
- Heavy Oil/Oil Sands
- Water Injection
- Geothermal
By Completion Type
- Open-Hole
- Cased-Hole
By Well Environment
- Onshore
- Offshore
- Deepwater
- Ultra-Deepwater
By Region
- North America
- Europe
- Asia Pacific
- Latin America
- Middle East & Africa
For inquiries regarding discounts, bulk purchases, or customization requests, please contact us at sales@precedenceresearch.com
Frequently Asked Questions





Ask For Sample
No cookie-cutter, only authentic analysis – take the 1st step to become a Precedence Research client
 Get a Sample




 sales@precedenceresearch.com
 Schedule a Meeting