


Crude Oil Flow Improvers Market Trends, Leading Companies, Company Revenue / Sales Performance, Plant Utilization, Production Volume, Pricing Dynamics, Supply Chain Performance, Competitive Landscape, and Industry Growth
Vidyesh Swar, a Chemical and Materials Industry Expert, estimates the crude oil flow improvers market at USD 2.37 billion in 2026, with the market projected to reach USD 3.94 billion by 2035 at a CAGR of 5.8%. Major crude oil flow improvers market companies such as Liquid Power Specialty Products, Baker Hughes, SLB (ChampionX), Clariant are competing across key material and application segments, including type, application, location and region.
Source: https://www.precedenceresearch.com/crude-oil-flow-improvers-market
 Get a Sample
 Table Of Content


Crude Oil Flow Improvers Market Size, Share, Trends, and Growth Forecast 2035
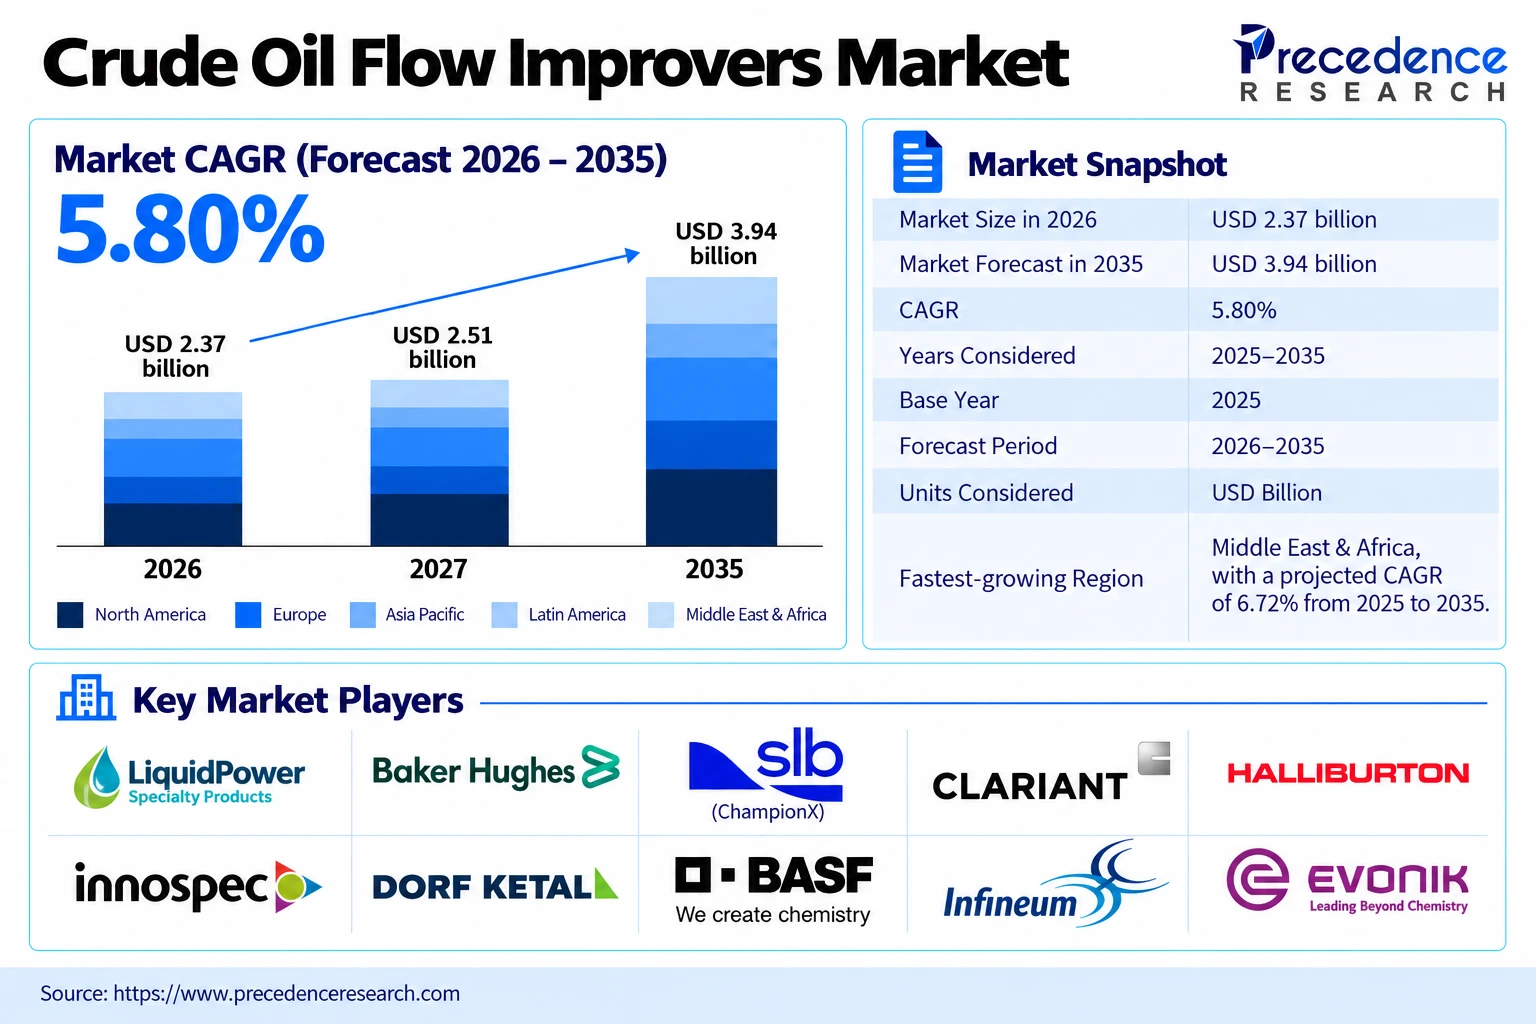
The crude oil flow improvers market is estimated at USD 2.51 billion in 2027 and is projected to reach USD 3.94 billion by 2035, expanding at a CAGR of 5.80% from 2026 to 2035. The crude oil flow improvers market was valued at USD 2.37 billion in 2026, the base year.
Key Takeaways
Market Size & Growth Outlook
- Market size in 2026: USD 2.37 billion
- Estimated market size in 2027: USD 2.51 billion
- Projected market size by 2036: USD 3.94 billion
- CAGR (2026-2035): 5.80%
Regional Market Spotlight
- North America led the market with a 36.80% (USD 0.82 billion) share in 2025.
- Middle East & Africa accounted for 22.40% (USD 0.50 billion) of the market in 2025 and is projected to be the fastest-growing region, at a CAGR of 6.72% from 2025 to 2035.
- Asia Pacific accounted for 17.60% (USD 0.39 billion) of the market in 2025.
Segmental Spotlight
- By type, Paraffin Inhibitors & Pour Point Depressants accounted for 30.40% (USD 0.68 billion) in 2025.
- By application, Pipeline accounted for 44.60% (USD 1.00 billion) in 2025.
- By location, Onshore accounted for 68.40% (USD 1.53 billion) in 2025.
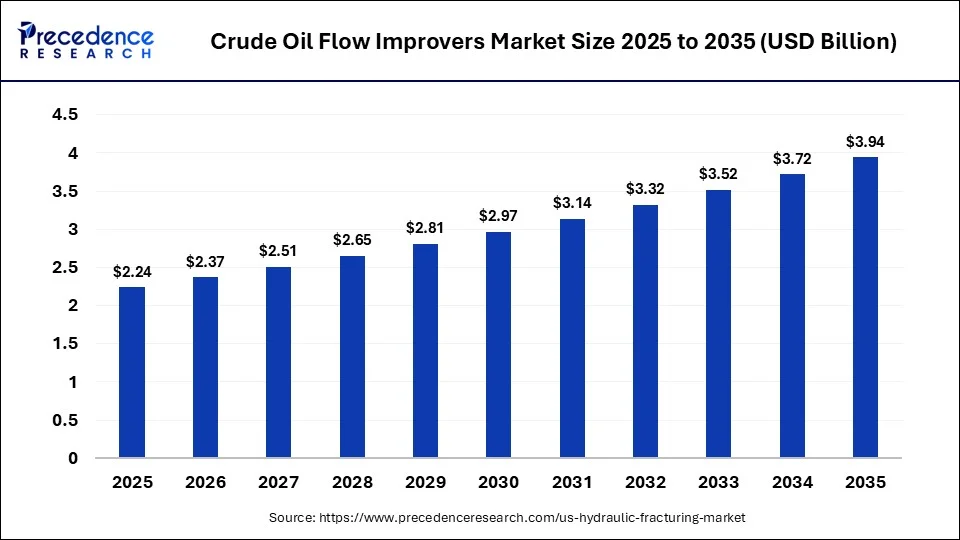
Crude Oil Flow Improvers Market Size and Forecast, 2025 to 2035 (USD Billion)
The crude oil flow improvers industry includes chemicals that are responsible for ensuring that crude oil flows from wells, pipelines, and refineries, including paraffin inhibitors and pour point depressants, drag reducing agents, asphaltene inhibitors, scale inhibitors, and hydrate inhibitors. The paraffin inhibitors were the biggest segment in 2025, constituting 30.40% of the share, due to the frequent wax deposition occurring in waxy crudes, cold weather, and subsea pipeline systems. North America had the leading regional revenue share of 36.80% in 2025 due to shale production, crude oil pipelines, and Gulf of Mexico operations. The key drivers include increasing capacity in existing pipelines without constructing new ones, rising waxy, heavy, and deep-water crude production, extended subsea tieback distances, and flow assurance in mature fields.
Sources: Expert interviews, secondary sources, Precedence Research database, and Precedence Research analysts.
The demand for crude oil flow improvers is expected to increase from USD 2.37 billion in 2026 to USD 3.94 billion in 2035 due to the deployment of drag-reducing agents by pipeline operators in order to transport more crude through the existing pipelines, while producers use flow assurance chemicals in order to keep waxy, heavy, and deepwater crudes free of deposits and blockages. Increased demand for flow assurance chemicals due to long subsea tiebacks and aging fields will take the market to USD 2.97 billion by 2030.
- Analyst View: The estimation is based on crude production and pipeline volumes, on a regional basis, by applying the percentage of crude that goes through treatment with different types of flow improvement chemicals and average prices for them. The percentage of treatments depends on properties of crude, its waxes and asphaltene content, on pipeline capacities, as well as on offshore and low-temperature conditions. The overall figure is corroborated with flow assurance and production chemicals revenues of the largest producers and with available estimations; our base year is somewhat higher than these numbers. The growth rate is driven by consistent crude production, debottlenecking of pipelines, and tougher crudes amid oil price fluctuations.
Market Trends
- Pipeline operators use drag reducers instead of new pumping capacity.
- Drag-reducing agent capacity is expanding in the United States.
- Flow assurance chemicals are tailored to specific crude blends.
- Digital monitoring is optimising chemical dosing.
- Longer subsea tiebacks need more wax and hydrate control.
- Heavy crude pipelines are using new drag reducer grades.
Drivers, Restraints and Opportunities
Drivers: Pipelines are operating close to full capacity, and the use of drag-reducing agents can increase flows rapidly without additional infrastructure. Waxy, viscous, and deepwater grades require additives to prevent deposits and blockages. Older oilfields and extended subsea tiebacks add to flow assurance requirements.
Constraints: Fossil fuel price drops can lower both output and spending on additives. Additional pipeline infrastructure may lower drag reducer demand on some pipelines. Chemical discharge environmental regulations increase compliance costs offshore.
Opportunities: Digitally controlled delivery and monitoring can boost the value of chemical services agreements. Brazilian, Guyanese, and West African deepwater operations will require high-end flow assurance chemicals. Drag reducer opportunities for refined products and heavy crudes provide potential outside of light crude pipelines.
Market Segmentation: 2025 Share and Value
Crude Oil Flow Improvers Market by Type 2025 Share & Size
| Segments | 2025 Share | 2025 Market Value |
| Paraffin Inhibitors & Pour Point Depressants | 30.40% | USD 0.68 billion |
| Drag Reducing Agents | 24.80% | USD 0.56 billion |
| Asphaltene Inhibitors | 16.20% | USD 0.36 billion |
| Scale Inhibitors | 15.40% | USD 0.34 billion |
| Hydrate Inhibitors | 13.20% | USD 0.30 billion |
Note: 2025 is the base year.
Sources: Expert interviews, secondary sources, Precedence Research database, and Precedence Research analysts.
The share of paraffin inhibitors and pour point depressants was 30.40% (USD 0.68 billion) in 2025, as they do not allow wax to accumulate in wellbores, pipelines, and tanks, particularly in the case of waxy crudes and in cold or undersea environments. The drag reducing agents were the most rapidly growing segment, occupying 24.80% (USD 0.56 billion) of the market, while asphaltene inhibitors made up 16.20% (USD 0.36 billion), scale inhibitors 15.40% (USD 0.34 billion), and hydrate inhibitors 13.20% (USD 0.30 billion), respectively.
Crude Oil Flow Improvers Market by Application 2025 Share & Size
| Segments | 2025 Share | 2025 Market Value |
| Pipeline | 44.60% | USD 1.00 billion |
| Extraction | 38.20% | USD 0.86 billion |
| Refinery | 12.80% | USD 0.29 billion |
| Others | 4.40% | USD 0.10 billion |
Note: 2025 is the base year.
Sources: Expert interviews, secondary sources, Precedence Research database, and Precedence Research analysts.
The use of the pipeline segment was 44.60% (USD 1.00 billion), with drag reducers and pour point depressants dominating the segment in crude trunk lines. The extraction segment, which is worth 38.20% (USD 0.86 billion), involves the well and gathering system treated for wax, asphaltene, scale, and hydrates. The refinery section is responsible for 12.80% (USD 0.29 billion), while other applications make up 4.40% (USD 0.10 billion).
Crude Oil Flow Improvers Market by Location 2025 Share & Size
| Segments | 2025 Share | 2025 Market Value |
| Onshore | 68.40% | USD 1.53 billion |
| Offshore | 31.60% | USD 0.71 billion |
Note: 2025 is the base year.
Sources: Expert interviews, secondary sources, Precedence Research database, and Precedence Research analysts.
The onshore segment makes up 68.40% (USD 1.53 billion), as most of the crude oil pipelines and wells are located on land. The offshore segment represents 31.60% (USD 0.71 billion) and consumes a higher amount of chemicals per barrel due to the cold temperature of the seabed and tie-backs, which increase the risk of wax and hydrate formation.
- Analyst View: The values of segments were calculated based on the matching of treated crude volumes with respect to types, applications, and locations with doses and prices. Wax inhibitors dominate since wax is the most common flow assurance issue, while drag reducers have the fastest growth rate with pipelines being utilized at full capacity.
Regional Analysis
Crude Oil Flow Improvers Market By Region 2025 Share & Size
| Region | 2025 Share | 2025 Market Value |
| North America | 36.80% | USD 0.82 billion |
| Middle East & Africa | 22.40% | USD 0.50 billion |
| Asia Pacific | 17.60% | USD 0.39 billion |
| Europe | 13.80% | USD 0.31 billion |
| Latin America | 9.40% | USD 0.21 billion |
Note: 2025 is the base year.
Sources: Expert interviews, secondary sources, Precedence Research database, and Precedence Research analysts.
In North America, there was growth of 36.80% (USD 0.82 billion) in 2025 through shale oil production, crude oil pipelines, and offshore Gulf of Mexico operations, which involve drag reducers and flow assurance chemicals. The Middle East and Africa had 22.40% (USD 0.50 billion), and this region is currently witnessing the fastest growth due to huge volumes of crude oil production, export pipelines, and offshore activities in West Africa. In Asia Pacific, there was growth of 17.60% (USD 0.39 billion) due to waxy crude oil production and pipeline transportation in China, India, and Southeast Asia. In Europe, there was growth of 13.80% (USD 0.31 billion).
North America accounted for 36.80% (USD 0.82 billion) in 2025. Shale, pipelines, and Gulf of Mexico operations drive demand.
The Middle East and Africa accounted for 22.40% (USD 0.50 billion) in 2025 and is the fastest-growing region. Crude exports and West African offshore projects drive growth.
Asia Pacific accounted for 17.60% (USD 0.39 billion) in 2025. Waxy crudes and pipelines in China and India support demand.
Europe accounted for 13.80% (USD 0.31 billion) in 2025. North Sea and Russian operations support demand.
Latin America accounted for 9.40% (USD 0.21 billion) in 2025. Deepwater and heavy crude production support growth.
- Analyst View: Regional share weights are a function of crude production, pipeline flow, and properties in each region, and were weighted using treatment costs and chemical costs. North America is the leader due to its extensive pipeline infrastructure and utilization of drag reducers. The Middle East and Africa have been assigned the highest growth premium due to their growing production and export capacity.
Top 10 Companies in the Crude Oil Flow Improvers Market
| Rank | Company Name | Market-Specific Revenue (USD Billion) | 2025 Share | Key Products / Business | Headquarters |
| 1 | LiquidPower Specialty Products | 0.32 | 14.29% | LiquidPower and ExtremePower drag-reducing agents. | United States |
| 2 | Baker Hughes | 0.28 | 12.50% | FLO drag reducers and flow assurance chemicals | United States |
| 3 | SLB (ChampionX) | 0.24 | 10.71% | Production and flow assurance chemicals | United States |
| 4 | Clariant | 0.12 | 5.36% | Paraffin control and pour point depressants | Switzerland |
| 5 | Halliburton | 0.1 | 4.46% | Production chemicals | United States |
| 6 | Innospec | 0.09 | 4.02% | Drag reducing agents and oilfield chemicals. | United States |
| 7 | Dorf Ketal | 0.08 | 3.57% | Flow improvers and refinery additives | India |
| 8 | BASF | 0.07 | 3.12% | Paraffin and asphaltene inhibitors | Germany |
| 9 | Infineum | 0.05 | 2.23% | Crude and fuel flow improvers | United Kingdom |
| 10 | Evonik | 0.04 | 1.79% | Pour point depressant polymers | Germany |
Note: Company revenues and shares are 2025 estimates.
Sources: Company press releases, expert interviews, secondary sources, Precedence Research database and Precedence Research analysts.
LiquidPower Specialty Products was the market leader in crude oil flow improvers with approximately 14.29% (USD 0.32 billion) share of 2025 revenues, followed by Baker Hughes with 12.50% (USD 0.28 billion), and SLB with 10.71% (USD 0.24 billion). LiquidPower Specialty Products leads in pipeline drag-reducing agents; Baker Hughes via its FLO drag reducers and flow assurance chemicals, and SLB via its production chemicals division through its acquisition of ChampionX. The ten leading companies together generated an estimated 62.05% (USD 1.39 billion) share of 2025 revenues, and the remaining 37.95% (USD 0.85 billion) revenue was captured by other oilfield chemical suppliers, polymer manufacturers, and refinery additives manufacturers. The market is somewhat concentrated, and the competition focuses on performance of chemicals for particular crudes, field services, reliability of supply, and long-term agreements with pipeline companies and producers.
Recent Developments
- July 2025: Baker Hughes won a multi-year contract from Genesis Energy to supply drag-reducing agents and chemicals for the Cameron Highway and Poseidon offshore oil pipelines in the US Gulf of Mexico.
- March 2025: Innospec announced an expansion of drag reducing agent production at its Pleasanton, Texas, plant, with new capacity due in the fourth quarter of 2025.
Market Segments
By Type
- Paraffin Inhibitors & Pour Point Depressants
- Drag Reducing Agents
- Asphaltene Inhibitors
- Scale Inhibitors
- Hydrate Inhibitors
By Application
- Pipeline
- Extraction
- Refinery
- Others
By Location
- Onshore
- Offshore
By Region
- North America (U.S., Canada, Mexico)
- Europe (Germany, U.K., France, Italy, Spain, Rest of Europe)
- Asia Pacific (China, Japan, India, South Korea, Taiwan, Rest of Asia Pacific)
- Latin America (Brazil, Argentina, Rest of Latin America)
- Middle East & Africa (GCC, South Africa, Rest of MEA)
Research Methodology
The crude oil flow improvers market was segmented into paraffin inhibitors and pour point depressants, drag reducing agents, asphaltene, scale, and hydrate inhibitors used in crude oil production, pipeline transport, and refining globally. The bottom-up approach for the 2025 base year involved calculations based on crude production volumes and throughput, treatment rates, dosages, and prices of chemicals, while the top-down approach verified market size using revenues from flow assurance and production chemicals of major producers. Segmentation, regional and company numbers were calculated based on chemical type, application, onshore/offshore and regional crude production. Critical numbers were reconciled based on company reports, regulations, industry statistics, and estimates by independent sources, while inconsistent inputs were not included in the study. All segmentation, regional, and company numbers were recalculated for the same base year of 2025, while forecasts from 2026 through 2035 with the same CAGR applied to the 2025 base year were calculated.
Analyst View Overall Market
The crude flow improver market is driven by crude production and pipeline capacity, with growth being generated through debottlenecking and more challenging crudes. Our model is based on demand tied to treated crude, dosage, and pricing; thus, our forecast is based on crude production and pipeline capacity. Upside drivers include drag reducer sales and deepwater flow assurance; downside includes cyclicality in oil prices and pipeline construction.
Sources and References
- Baker Hughes. "Baker Hughes to supply drag-reducing agents to Genesis Energy, increasing offshore pipeline capacity". 2025-07-24. DRA contract for Gulf of Mexico pipelines. (Source: https://www.bakerhughes.com)
- Nasdaq / Innospec. "Innospec Inc. expands production capacity for drag reducing agent technologies in Pleasanton, TX". 2025-03-03. DRA capacity expansion. (Source: https://www.nasdaq.com)
- Digital Refining. "Clariant Refinery Services opens state-of-the-art crude and fuel oil lab in the UK". 2020-01-28. Pour point depressant laboratory. (Source: https://www.digitalrefining.com)
- LiquidPower Specialty Products. "Company history". Undated. LSPI history and Berkshire acquisition. (Source: https://www.liquidpower.com)
For inquiries regarding discounts, bulk purchases, or customization requests, please contact us at sales@precedenceresearch.com
Frequently Asked Questions





Ask For Sample
No cookie-cutter, only authentic analysis – take the 1st step to become a Precedence Research client
 Get a Sample




 sales@precedenceresearch.com
 Schedule a Meeting