AI Contract Management Platform Market Size is USD 471.54 Million in 2026
AI Contract Management Platform Market (By Type: Web-based, Software-based; By Application: Corporate and Business, Employment and HR, Real Estate, Financial Services and Investment, Others; By Region: North America, Europe, Asia-Pacific, Latin America, Middle East & Africa) Industry Size, Share, Growth, Trends 2026 to 2035.


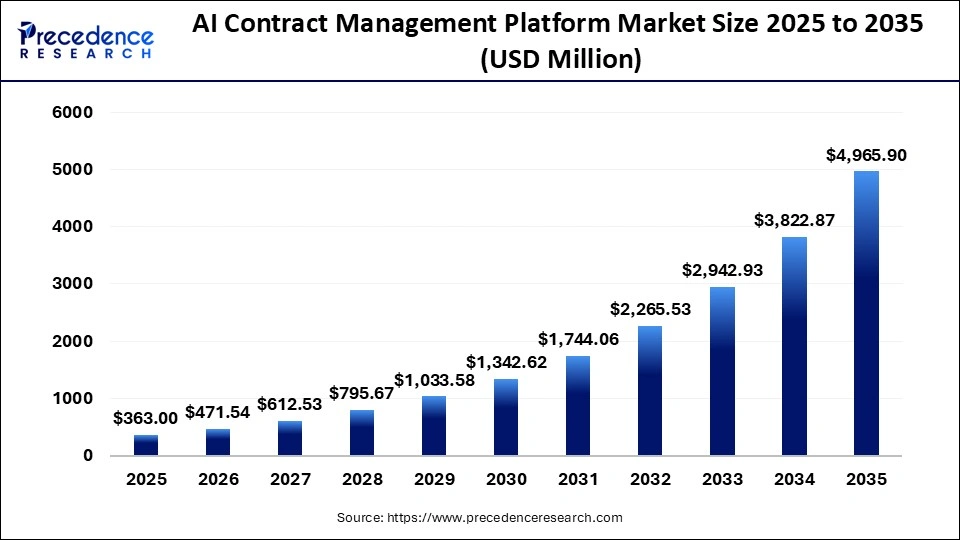
The AI contract management platform market size was estimated at USD 363.00 million in 2025 and is predicted to increase from USD 471.54 million in 2026 to approximately USD 4,965.90 million by 2035, expanding at A CAGR of 29.9% from 2026 to 2035. The market is mainly driven by the increasing need for legal compliance, reducing risks, enhancing operational efficiency, and the broad digital transformation of corporate legal processes.
AI Contract Management Platform Market Statical Scope
| Reports Attributes | Statistics |
| Market Size in 2025 | USD 363.00 Million |
| Market Size in 2026 | USD 471.54 Million |
| Market Size by 2035 | USD 4,965.90 Million |
| CAGR 2026 to 2035 | 29.9% |
| Base Year | 2025 |
| Forecast Period | 2026 to 2035 |
An AI contract management platform is a software tool that leverages artificial intelligence, including machine learning and natural language processing, to streamline the entire contract lifecycle, drafting, negotiation, compliance, and renewal. It reduces contract review times from hours to minutes, uncovers hidden risks, and ensures compliance. The platform generates initial drafts with pre-approved clauses and automatically redlines documents during negotiations.
It analyzes thousands of documents for potential liabilities, unusual clauses, and compliance issues, while also identifying key commitments like dates and fees to avoid missed deadlines. Furthermore, it digitizes and organizes agreements for quick searching and accelerates the contract cycle by automating approval workflows and routing contracts to appropriate stakeholders based on risk and value.
AI management platforms modernize legal and procurement workflows by automating, analyzing, and managing contracts with AI. They enhance efficiency, minimize errors, and reduce risks by identifying non-compliant terms, resulting in faster contract turnaround and significant cost savings. AI automates tasks like drafting and reviewing, making contract cycles quicker. It also detects potential liabilities and non-compliant clauses in real-time, helping organizations avoid legal issues.
By ensuring compliance with company standards, AI reduces human error and the risk of disputes. Streamlining the contracting process alleviates administrative burdens and prevents revenue loss from missed renewals or misinterpretations. AI provides advanced search and analytics for tracking obligations and improving negotiation strategies, while also optimizing the routing and approval process to ensure timely stakeholder engagement.
This sector is vital as it transforms static paper contracts into dynamic, structured data assets that enhance business value. Natural Language Processing (NLP) automatically extracts essential data points like termination dates and payment terms from extensive contract archives. Traditional systems prioritize storage, while AI platforms utilize anomaly detection to identify hidden risks and unclear terms in numerous documents for human review. Tools from Sirion, Icertis, and LexCheck identify outliers, such as liability clauses that deviate from company standards, preventing future issues.
Contracts are often dispersed across departments. AI-driven Contract Lifecycle Management (CLM) centralizes them, linking legal, procurement, sales, and finance. Finance teams can seamlessly transfer payment terms to ERP systems, while sales teams can quickly create Non-
Disclosure Agreements (NDAs) through self-service portals, reducing reliance on legal. While many tools emphasize the pre-signature phase, AI excels in post-signature intelligence monitoring obligations and commitments after signing.
AI continuously tracks Key Performance Indicators (KPIs), deliverables, and upcoming renewals to ensure companies realize negotiated value and avoid penalties for unmet commitments. The market is swiftly shifting towards cloud-based solutions, with Small and Medium Enterprises (SMEs) leading in adoption due to affordable, specialized AI tools.
AI Contract Management Platform Market Share, By Region, 2025 (%)
| Regions | Shares (%) |
| North America | 38% |
| Europe | 25% |
| Asia Pacific | 22% |
| Latin America | 8% |
| Middle East & Africa | 7% |
- North America – It leads the market and, with a 38.0% share, benefits from early AI adoption and strong enterprise demand.
- Europe – It shows steady growth and, with a 25.0% share, follows due to regulatory diversity and moderate adoption.
- Asia Pacific – Why it is gaining momentum: “It is rapidly expanding and, with a 22.0% share, is driven by digital transformation and growing enterprise adoption.
- Latin America – Why it does not dominate: “It is developing gradually and, with an 8.0% share, is limited by lower technology penetration.
- Middle East & Africa – Why it does not dominate: “It is emerging steadily and, with a 7.0% share, faces constraints from infrastructure and investment challenges.
AI Contract Management Platform Market Share, By Type, 2025 (%)
| Segments | Shares (%) |
| Web-based | 55% |
| Software-based | 45% |
- Web-based – It leads adoption due to accessibility and scalability and, with a 55.0% share, benefits from cloud-based deployment preferences.
- Software-based – It offers on-premise control and, with a 45.0% share, lags due to higher maintenance and limited flexibility.
AI Contract Management Platform Market Share, By Application, 2025 (%)
| Segments | Shares (%) |
| Corporate and Business | 35% |
| Employment and HR | 20% |
| Real Estate | 15% |
| Financial Services and Investment | 20% |
| Others | 10% |
- Corporate and Business – It drives primary demand for contract automation and, with a 35.0% share, benefits from high contract volumes and compliance needs.
- Employment and HR – It supports workforce contract management and, with a 20.0% share, remains limited to specific HR use cases.
- Real Estate – It manages property agreements and, with a 15.0% share, is constrained by narrower application scope.
- Financial Services and Investment – It is expanding with regulatory complexity and, with a 20.0% share, is driven by increasing need for compliance and risk management.
- Others – It covers niche applications and, with a 10.0% share, remains limited due to fragmented demand.
Top Companies AI Contract Management Platform Market
- Legitt AI
- Contractable
- Yeschat
- Writify.AI
- Juro
- Wethos
- Eden AI
- ContractPod
- Foxit Software
- Weaver Network Technology
- Docusign
- ContractWorks
- ContractSponge
- ContractZen
- ContractRoom
Segments Covered in the Report
By Type
- Web-based
- Software-based
By Application
- Corporate and Business
- Employment and HR
- Real Estate
- Financial Services and Investment
- Others
By Region
- North America
- Europe
- Asia Pacific
- Latin America
- Middle East & Africa
| Type | 2025 | 2026 | 2027 | 2028 | 2029 | 2030 | 2031 | 2032 | 2033 | 2034 | 2035 |
|---|---|---|---|---|---|---|---|---|---|---|---|
| Web-based | 200.38 | 261.23 | 340.57 | 443.98 | 578.80 | 754.55 | 983.65 | 1282.29 | 1671.58 | 2179.04 | 2840.49 |
| Software-based | 162.62 | 210.31 | 271.96 | 351.69 | 454.78 | 588.07 | 760.41 | 983.24 | 1271.35 | 1643.83 | 2125.41 |
| Application | 2025 | 2026 | 2027 | 2028 | 2029 | 2030 | 2031 | 2032 | 2033 | 2034 | 2035 |
|---|---|---|---|---|---|---|---|---|---|---|---|
| Corporate and Business | 127.41 | 165.98 | 216.22 | 281.67 | 366.92 | 477.97 | 622.63 | 811.06 | 1056.51 | 1376.23 | 1792.69 |
| Employment and HR | 72.78 | 94.78 | 123.42 | 160.73 | 209.30 | 272.55 | 354.92 | 462.17 | 601.83 | 783.69 | 1020.49 |
| Real Estate | 54.34 | 70.45 | 91.33 | 118.40 | 153.49 | 198.98 | 257.95 | 334.39 | 433.49 | 561.96 | 728.50 |
| Financial Services and Investment | 72.67 | 94.50 | 122.87 | 159.77 | 207.75 | 270.14 | 351.25 | 456.73 | 593.88 | 772.22 | 1004.10 |
| Others | 35.79 | 45.83 | 58.68 | 75.11 | 96.12 | 122.98 | 157.31 | 201.18 | 257.21 | 328.77 | 420.12 |
| Region | 2025 | 2026 | 2027 | 2028 | 2029 | 2030 | 2031 | 2032 | 2033 | 2034 | 2035 |
|---|---|---|---|---|---|---|---|---|---|---|---|
| North America | 137.21 | 177.30 | 229.09 | 295.99 | 382.42 | 494.08 | 638.33 | 824.65 | 1065.34 | 1376.23 | 1777.79 |
| Europe | 90.39 | 116.94 | 151.29 | 195.73 | 253.23 | 327.60 | 423.81 | 548.26 | 709.25 | 917.49 | 1186.85 |
| Asia Pacific | 80.95 | 106.57 | 140.27 | 184.60 | 242.89 | 319.54 | 420.32 | 552.79 | 726.90 | 955.72 | 1256.37 |
| Latin America | 29.22 | 38.19 | 49.92 | 65.24 | 85.27 | 111.44 | 145.63 | 190.30 | 248.68 | 324.94 | 424.58 |
| Middle East & Africa | 25.23 | 32.54 | 41.96 | 54.11 | 69.77 | 89.96 | 115.98 | 149.52 | 192.76 | 248.49 | 320.30 |
Research Methodology
Related Databooks
March 2026
March 2026
April 2026
April 2026

 sales@precedenceresearch.com
 +1 804-441-9344
 Download Databook
 Schedule a Meeting