AI Deception Tools Market Size is USD 1,054.69 Million in 2026
AI Deception Tools Market (By End Use: Healthcare, BFSI, Telecom & IT, Government, Retail, Others; By Application: Fraud Detection, Cyber Security, Others (Data Privacy, Information Verification); By Technology: Natural Language Processing (NLP), Machine Learning, LLM, Generative AI (GANs), Computer Vision, Others (Attack Simulation, Digital Twin); By Region: North America, LAMEA, Europe, Asia-Pacific) Industry Size, Share, Growth, Trends 2026 to 2035.


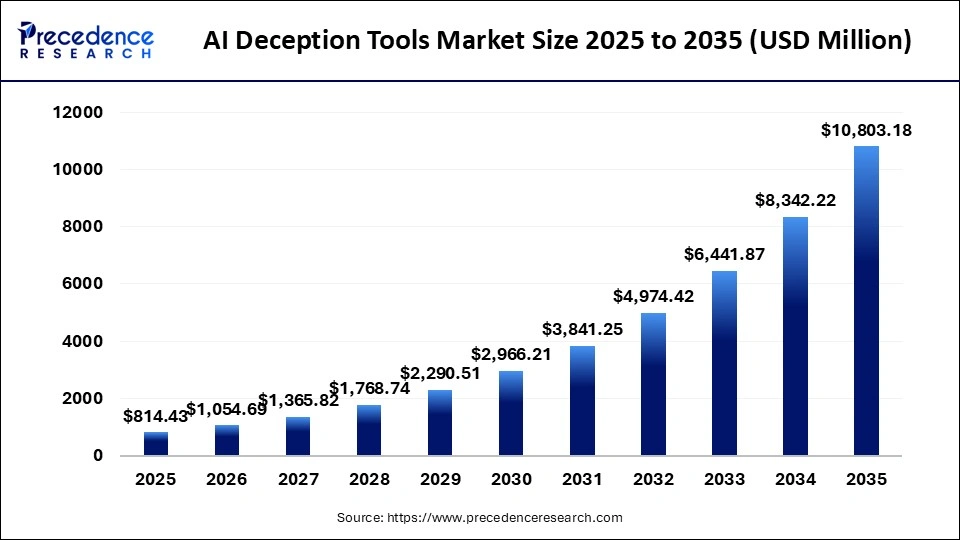
The AI deception tools market size was estimated at USD 814.43 million in 2025 and is predicted to increase from USD 1,054.69 million in 2026 to approximately USD 10,803.18 million by 2035, expanding at A CAGR of 29.5% from 2026 to 2035. The rising complexity of cyber threats and demand for advanced security measures are fostering the growth.
AI Deception Tools Market Statical Scope
| Reports Attributes | Statistics |
| Market Size in 2025 | USD 814.43 Million |
| Market Size in 2026 | USD 1,054.69 Million |
| Market Size by 2035 | USD 10,803.18 Million |
| CAGR 2026 to 2035 | 29.5% |
| Base Year | 2025 |
| Forecast Period | 2026 to 2035 |
Deception technology works by deploying decoy assets, such as servers, credentials, data, and systems across a network. These decoys appear legitimate and are indistinguishable from authentic resources, as they are specifically designed to attract attackers. By integrating AI, these decoys evolve into highly contextual and adaptive traps that can outsmart even the most astute attackers. The market for AI deception tools includes technologies capable of simulating, manipulating, and creating realistic content. These tools are extensively used in cybersecurity testing, military training, fraud detection, digital media, and adversarial AI studies.
The primary types of AI deception tools comprise generative adversarial networks, fuzzing tools, data poisoning tools, attack simulation tools and others. GANs, for instance, are machine learning frameworks where two neural networks compete to produce highly realistic synthetic data that resembles real-world examples. These tools leverage technologies such as natural language processing, machine learning, large language models, generative AI, and computer vision. AI deception tools can be deployed through cloud-based, on-premises, and hybrid systems, and are applied in fields like fraud detection, security testing, and data privacy.
The market's expansion is driven by the continuously evolving nature of cyberattacks, with attackers increasingly employing stealthy, long-term strategies to infiltrate and navigate networks undetected. A significant factor in this growth is the rise of AI-driven social engineering and misinformation attacks, including deepfakes and AI-crafted phishing schemes. Cybercriminals utilize generative AI to create highly realistic, personalized fraudulent content that often bypasses traditional security measures.
Looking ahead, strong investor confidence and rapid technological advancements signal the long-term viability and potential for innovation within the market. This innovation is essential, as technology now allows for voice cloning with just three seconds of audio, creating sophisticated social engineering threats.
AI Deception Tools Market Share, By Region, 2025 (%)
| Regions | Shares (%) |
| North America | 36% |
| Europe | 25% |
| Asia-Pacific | 20% |
| Latin America | 10% |
| Middle East & Africa | 9% |
- North America - Dominates with 36% due to strong adoption of AI technologies in the US and Canada, particularly in the BFSI and government sectors.
- Europe - Does not dominate with 25%, but is growing in importance with increasing regulatory requirements and AI adoption in cybersecurity and fraud detection.
- Asia-Pacific - Does not dominate with 20%, but is gaining traction as countries in the region increasingly implement AI to combat cyber threats and fraud.
- Latin America- Does not dominate with 10%, but is growing as AI technologies become more accessible and are integrated into local industries, particularly in the banking sector.
- Middle East & Africa - Does not dominate with 9%, but adoption is increasing as governments and industries focus on securing critical infrastructure and sensitive data.
AI Deception Tools Market Share, By End Use, 2025 (%)
| Segments | Shares (%) |
| Healthcare | 15% |
| BFSI | 35% |
| Telecom & IT | 10% |
| Government | 20% |
| Retail | 10% |
| Others | 10% |
Healthcare - Does not dominate with 15%, but growing in importance as healthcare organizations increasingly use AI to detect fraud, ensure data privacy, and protect patient information.
BFSI - Dominates with 35% due to the high demand for AI deception tools in the banking, financial services, and insurance industries to combat fraud, ensure compliance, and enhance security measures.
Telecom & IT - Does not dominate with 10%, but these sectors benefit from AI-driven fraud detection and network security tools.
Government - Gaining momentum with 20% as governments around the world implement AI to improve cybersecurity, protect sensitive data, and detect fraud across various public sectors.
Retail - Does not dominate with 10%, though retail sectors are increasingly adopting AI tools for fraud prevention and customer data protection.
Others - Does not dominate with 10%, representing smaller sectors where AI deception tools are used for niche applications.
AI Deception Tools Market Share, By Application, 2025 (%)
| Segments | Shares (%) |
| Fraud Detection | 40% |
| Cyber Security | 45% |
| Others (Data Privacy, Information Verification) | 15% |
- Fraud Detection - Gaining momentum with 40% as AI plays a key role in identifying and preventing fraudulent activities across multiple industries, including banking and e-commerce.
- Cyber Security - Dominates with 45% due to the critical need for AI-driven security tools to detect, mitigate, and respond to increasingly sophisticated cyber threats.
- Others (Data Privacy, Information Verification) - Does not dominate with 15%, representing applications in data privacy, information verification, and other specialized fraud protection measures.
AI Deception Tools Market Share, By Technology, 2025 (%)
| Segments | Shares (%) |
| Natural Language Processing (NLP) | 10% |
| Machine Learning | 34% |
| LLM | 15% |
| Generative AI (GANs) | 12% |
| Computer Vision | 18% |
| Others (Attack Simulation, Digital Twin) | 11% |
- Natural Language Processing (NLP) - Does not dominate with 10%, though NLP is useful for applications like phishing detection and analyzing communications for deceptive language.
- Machine Learning - Dominates with 34% as machine learning algorithms are the core of many AI deception tools, helping improve fraud detection and predictive capabilities.
- LLM - Does not dominate with 15%, though large language models are growing in use for their ability to identify and generate deceptive content.
- Generative AI (GANs) - Gaining momentum with 12% as generative adversarial networks (GANs) are used for simulating attacks, training AI systems to recognize and prevent them.
- Computer Vision - Does not dominate with 18%, but computer vision is important for identifying visual fraud, including in surveillance and video data.
- Others (Attack Simulation, Digital Twin) - Does not dominate with 11%, representing other technologies such as attack simulation or digital twins.
Top Companies of AI Deception Tools Market
- SentinelOne
- Acalvio Technologies, Inc.
- Proofpoint, Inc.
- Cynet
- Commvault
- Smokescreen
- Fidelis Security
- NeroTeam Security Labs
- CyberTrap Machine Learning GmbH
- Fortinet, Inc.
Segments Covered in the Report
By End Use
- Healthcare
- BFSI
- Telecom & IT
- Government
- Retail
- Others
By Application
- Fraud Detection
- Cyber Security
- Others (Data Privacy, Information Verification)
By Technology
- Natural Language Processing (NLP)
- Machine Learning
- LLM
- Generative AI (GANs)
- Computer Vision
- Others (Attack Simulation, Digital Twin)
By Region
- North America
- Europe
- Asia Pacific
- Latin America
- Middle East & Africa
| End Use | 2025 | 2026 | 2027 | 2028 | 2029 | 2030 | 2031 | 2032 | 2033 | 2034 | 2035 |
|---|---|---|---|---|---|---|---|---|---|---|---|
| Healthcare | 122.16 | 159.26 | 207.60 | 270.62 | 352.74 | 459.76 | 599.23 | 780.98 | 1017.82 | 1326.41 | 1728.51 |
| BFSI | 285.05 | 365.98 | 469.84 | 603.14 | 774.19 | 993.68 | 1275.29 | 1636.58 | 2100.05 | 2694.54 | 3457.02 |
| Telecom & IT | 81.44 | 104.41 | 133.85 | 171.57 | 219.89 | 281.79 | 361.08 | 462.62 | 592.65 | 759.14 | 972.29 |
| Government | 162.89 | 216.21 | 286.82 | 380.28 | 503.91 | 667.40 | 883.49 | 1168.99 | 1546.05 | 2043.84 | 2700.79 |
| Retail | 81.44 | 104.41 | 133.85 | 171.57 | 219.89 | 281.79 | 361.08 | 462.62 | 592.65 | 759.14 | 972.29 |
| Others | 81.44 | 104.41 | 133.85 | 171.57 | 219.89 | 281.79 | 361.08 | 462.62 | 592.65 | 759.14 | 972.29 |
| Application | 2025 | 2026 | 2027 | 2028 | 2029 | 2030 | 2031 | 2032 | 2033 | 2034 | 2035 |
|---|---|---|---|---|---|---|---|---|---|---|---|
| Fraud Detection | 325.77 | 426.09 | 557.25 | 728.72 | 952.85 | 1245.81 | 1628.69 | 2129.05 | 2782.89 | 3637.21 | 4753.40 |
| Cyber Security | 366.49 | 472.50 | 609.16 | 785.32 | 1012.41 | 1305.13 | 1682.47 | 2168.85 | 2795.77 | 3603.84 | 4645.37 |
| Others | 122.16 | 156.09 | 199.41 | 254.70 | 325.25 | 415.27 | 530.09 | 676.52 | 863.21 | 1101.17 | 1404.41 |
| Technology | 2025 | 2026 | 2027 | 2028 | 2029 | 2030 | 2031 | 2032 | 2033 | 2034 | 2035 |
|---|---|---|---|---|---|---|---|---|---|---|---|
| NLP | 81.44 | 104.41 | 133.85 | 171.57 | 219.89 | 281.79 | 361.08 | 462.62 | 592.65 | 759.14 | 972.29 |
| Machine Learning | 276.91 | 355.43 | 456.18 | 585.45 | 751.29 | 964.02 | 1236.88 | 1586.84 | 2035.63 | 2611.12 | 3348.98 |
| LLM | 122.16 | 161.37 | 213.07 | 281.23 | 371.06 | 489.43 | 645.33 | 850.63 | 1120.89 | 1476.57 | 1944.57 |
| Generative AI | 97.73 | 130.78 | 174.82 | 233.47 | 311.51 | 415.27 | 553.14 | 736.21 | 979.16 | 1301.39 | 1728.51 |
| Computer Vision | 146.60 | 188.79 | 243.12 | 313.07 | 403.13 | 519.09 | 668.38 | 860.57 | 1108.00 | 1426.52 | 1836.54 |
| Others | 89.59 | 113.91 | 144.78 | 183.95 | 233.63 | 296.62 | 376.44 | 477.54 | 605.54 | 767.48 | 972.29 |
| Region | 2025 | 2026 | 2027 | 2028 | 2029 | 2030 | 2031 | 2032 | 2033 | 2034 | 2035 |
|---|---|---|---|---|---|---|---|---|---|---|---|
| North America | 293.19 | 376.52 | 483.50 | 620.83 | 797.10 | 1023.34 | 1313.71 | 1686.33 | 2164.47 | 2777.96 | 3565.05 |
| Europe | 203.61 | 261.56 | 335.99 | 431.57 | 554.30 | 711.89 | 914.22 | 1173.96 | 1507.40 | 1935.40 | 2484.73 |
| Asia-Pacific | 162.89 | 215.16 | 284.09 | 374.97 | 494.75 | 652.57 | 860.44 | 1134.17 | 1494.51 | 1968.76 | 2592.76 |
| Latin America | 81.44 | 104.41 | 133.85 | 171.57 | 219.89 | 281.79 | 361.08 | 462.62 | 592.65 | 759.14 | 972.29 |
| MEA | 73.30 | 97.03 | 128.39 | 169.80 | 224.47 | 296.62 | 391.81 | 517.34 | 682.84 | 900.96 | 1188.35 |
Research Methodology
Related Databooks
March 2026
April 2026
April 2026
April 2026

 sales@precedenceresearch.com
 +1 804-441-9344
 Download Databook
 Schedule a Meeting