AI for Data Analytics Market Size is USD 6,324.32 Million in 2026
AI for Data Analytics Market (By Type: Cloud-based, Local Deployment; By Application: Healthcare and Life Sciences, Retail and E-Commerce, Financial Services and Banking, Manufacturing, Others.; By Region: North America, Europe, Asia-Pacific, Latin America, Middle East & Africa) Industry Size, Share, Growth, Trends 2026 to 2035.


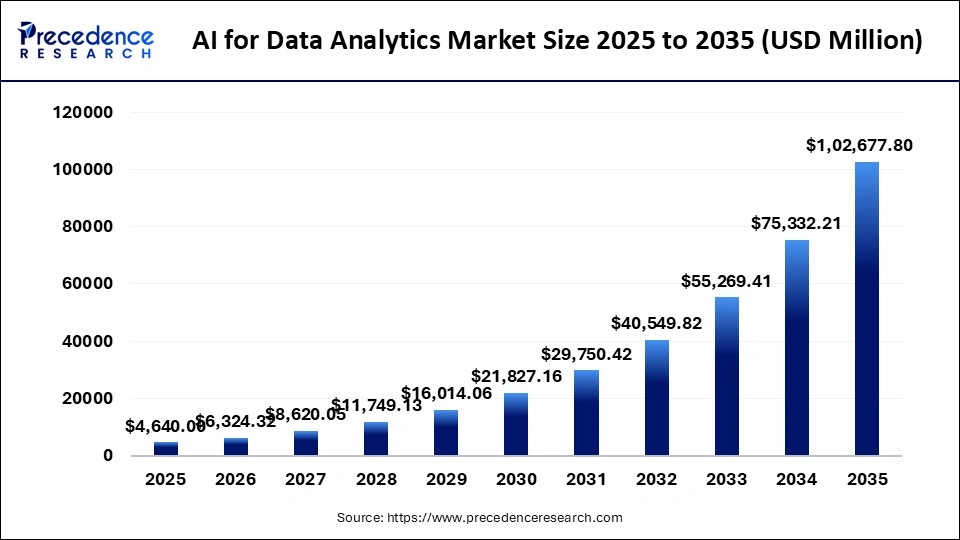
The AI for data analytics market size was estimated at USD 4,640.00 million in 2025 and is predicted to increase from USD 6,324.32 million in 2026 to approximately USD 102,677.80 million by 2035, expanding at A CAGR of 36.3% from 2026 to 2035. The AI for data analytics market is mainly driven by the necessity to handle rapid data growth, the need for actionable real-time insights, and the widespread availability of analytics tools.
AI for Data Analytics Market Statical Scope
| Reports Attributes | Statistics |
| Market Size in 2025 | USD 3,625.00 Million |
| Market Size in 2026 | USD 4,074.50 Million |
| Market Size by 2035 | USD 11,667.32 Million |
| CAGR 2026 to 2035 | 36.3% |
| Base Year | 2025 |
| Forecast Period | 2026 to 2035 |
AI data analytics integrates machine learning, natural language processing, and automated algorithms to analyze complex datasets. It provides automated insights, predictive capabilities, and smart recommendations, surpassing traditional methods. This approach accelerates data preparation and improves decision-making by identifying patterns, trends, and anomalies in real-time, unlike manual techniques.
While traditional analytics focuses on historical data, AI forecasts future outcomes and recommends optimal actions. Moreover, AI streamlines data cleaning and problem detection, saving analysts time. Users can query their data in plain English rather than using complex code, making analytics more accessible. AI also quickly detects unusual patterns, essential for identifying fraud or IT issues.
AI in data analytics is crucial as it streamlines complex data processing, resulting in quicker, more accurate insights and improved decision-making. It enhances accessibility through natural language queries, manages large datasets, and allows analysts to focus on strategic goals by automating repetitive tasks like data cleaning. AI processes huge amounts of structured and unstructured data in real-time, delivering insights that surpass manual analysis.
It not only reviews past events but also identifies patterns to predict future trends and recommend actions. By automating analytics and minimizing manual errors, AI boosts data accuracy, leading to better business decisions. Tools like Natural Language Querying (NLQ) empower non-technical users to access data easily, breaking down databases and improving accessibility.
The AI market in data analytics is rapidly evolving from traditional reporting to proactive intelligence. This shift transforms big data from a costly burden into a strategic asset through real-time processing and unstructured data analysis. AI models can predict customer demand, churn, and equipment failures, enabling businesses to adopt proactive planning instead of reactive damage control. Manufacturing firms utilize AI to monitor sensor data, anticipate equipment failures, and schedule preventive maintenance to minimize downtime.
Tools like Decision Point's BeagleGPT enable users to integrate various data sources and leverage conversational BI for real-time insights via platforms like Microsoft Teams. AI can also assess social media, customer support calls, emails, and images to gauge sentiment and identify risks. For instance, a retailer can analyze a million customer reviews to detect early product defects that traditional surveys might overlook.
As data generation shifts to the edge, such as IoT, factory floors, and retail aisles, AI analytics is increasingly moving away from centralized data warehouses to lightweight models that can be run onsite.
Intelligent Building Automation Technologies Market Share, By Region, 2025 (%)
| Regions | Shares (%) |
| North America | 38% |
| Europe | 25% |
| Asia Pacific | 22% |
| Latin America | 8% |
| Middle East & Africa | 7% |
- North America – It leads the market and, with a 38% share, benefits from advanced technology infrastructure and early AI adoption.
Europe – It shows steady growth and, with a 25% share, follows due to regulatory complexity and moderate adoption rates.
Asia Pacific – It is rapidly expanding and, with a 22% share, is driven by digitalization and growing enterprise adoption.
Latin America – It is developing gradually and, with an 8% share, is limited by lower technological investment.
Middle East & Africa – It is emerging steadily and, with a 7% share, faces constraints from infrastructure and adoption challenges.
Intelligent Building Automation Technologies Market Share, By Type, 2025 (%)
| Segments | Shares (%) |
|
Cloud-based
|
62% |
| Local Deployment | 38% |
- Cloud-based – It leads deployment models due to scalability and flexibility and, with a 62% share, benefits from widespread cloud adoption and lower infrastructure costs.
- Local Deployment – It offers greater data control and, with a 38% share, lags due to higher costs and limited scalability.
Intelligent Building Automation Technologies Market Share, By Application, 2025 (%)
| Segments | Shares (%) |
| Healthcare and Life Sciences | 18% |
| Retail and E-Commerce | 16% |
| Financial Services and Banking | 20% |
| Manufacturing | 14% |
| Others | 32% |
- Healthcare and Life Sciences – It leverages AI for diagnostics and research and, with an 18% share, remains limited by regulatory and data privacy challenges.
- Retail and E-Commerce – It enhances customer insights and personalization and, with a 16% share, is constrained by competitive and cost pressures.
- Financial Services and Banking – It drives strong adoption for risk analysis and fraud detection and, with a 20% share, leads due to high data intensity and compliance needs.
- Manufacturing – It supports predictive maintenance and operations and, with a 14% share, is limited by slower digital transformation.
- Others – It spans diverse industries and, with a 32% share, is expanding as AI adoption broadens across sectors.
Top Companies of AI for Data Analytics Market
- IBM
- Alibaba
- AWS
- Baidu
- Cloudera
- Databricks
- DataRobot
- Google Cloud
- Huawei
- Microsoft Azure
- Oracle
- Palantir
- Qlik
- Salesforce
- SAP
- SAS
- Snowflake
- Splunk
- Tableau
- Teradata
- Innodata
Segments Covered in the Report
By Type
- Cloud-based
- Local Deployment
By Application
- Healthcare and Life Sciences
- Retail and E-Commerce
- Financial Services and Banking
- Manufacturing
- Others
By Region
- North America
- Europe
- Asia Pacific
- Latin America
- Middle East & Africa
| Type | 2025 | 2026 | 2027 | 2028 | 2029 | 2030 | 2031 | 2032 | 2033 | 2034 | 2035 |
|---|---|---|---|---|---|---|---|---|---|---|---|
| Cloud-based | 2784.00 | 3921.08 | 5516.83 | 7754.43 | 10889.56 | 15279.01 | 21420.30 | 30006.87 | 42004.75 | 58759.12 | 82142.24 |
| Local Deployment | 1856.00 | 2403.24 | 3103.22 | 3994.70 | 5124.50 | 6548.15 | 8330.12 | 10542.95 | 13264.66 | 16573.09 | 20535.56 |
| Application | 2025 | 2026 | 2027 | 2028 | 2029 | 2030 | 2031 | 2032 | 2033 | 2034 | 2035 |
|---|---|---|---|---|---|---|---|---|---|---|---|
| Healthcare and Life Sciences | 788.80 | 1094.11 | 1517.13 | 2103.09 | 2914.56 | 4038.02 | 5593.08 | 7745.02 | 10722.27 | 14840.45 | 20535.56 |
| Retail and E-Commerce | 696.00 | 954.97 | 1310.25 | 1797.62 | 2466.17 | 3383.21 | 4641.07 | 6366.32 | 8732.57 | 11977.82 | 16428.45 |
| Financial Services and Banking | 974.40 | 1340.76 | 1844.69 | 2537.81 | 3491.07 | 4801.98 | 6604.59 | 9083.16 | 12490.89 | 17175.74 | 23615.89 |
| Manufacturing | 696.00 | 936.00 | 1258.53 | 1691.87 | 2274.00 | 3055.80 | 4105.56 | 5514.78 | 7406.10 | 9943.85 | 13348.11 |
| Others | 1484.80 | 1998.49 | 2689.46 | 3618.73 | 4868.27 | 6548.15 | 8806.12 | 11840.55 | 15917.59 | 21394.35 | 28749.78 |
| Region | 2025 | 2026 | 2027 | 2028 | 2029 | 2030 | 2031 | 2032 | 2033 | 2034 | 2035 |
|---|---|---|---|---|---|---|---|---|---|---|---|
| North America | 1716.80 | 2314.70 | 3120.46 | 4206.19 | 5668.98 | 7639.51 | 10293.65 | 13868.04 | 18681.06 | 25160.96 | 33883.67 |
| Europe | 1206.40 | 1631.67 | 2206.73 | 2984.28 | 4035.54 | 5456.79 | 7378.10 | 9975.26 | 13485.74 | 18230.39 | 24642.67 |
| Asia Pacific | 1067.20 | 1486.22 | 2068.81 | 2878.54 | 4003.51 | 5565.93 | 7735.11 | 10745.70 | 14922.74 | 20716.36 | 28749.78 |
| Latin America | 371.20 | 509.11 | 698.22 | 957.55 | 1313.15 | 1800.74 | 2469.28 | 3385.91 | 4642.63 | 6365.57 | 8727.61 |
| Middle East & Africa | 278.40 | 382.62 | 525.82 | 722.57 | 992.87 | 1364.20 | 1874.28 | 2574.91 | 3537.24 | 4858.93 | 6674.06 |
Research Methodology
Related Databooks
March 2026
March 2026
April 2026
April 2026

 sales@precedenceresearch.com
 +1 804-441-9344
 Download Databook
 Schedule a Meeting