AI in Environmental Sustainability Market Size is USD 23.74 Billion in 2026
AI in Environmental Sustainability Market (By Application: Climate Change Mitigation, Renewable Energy Optimization, Waste Management, Water Resource Management, Biodiversity & Wildlife Monitoring, Precision Agriculture, Air Quality Monitoring, Natural Disaster Prediction & Response; By Technology: Machine Learning, Computer Vision, Natural Language Processing, Predictive Analytics, Reinforcement Learning; By End Use: Government & Public Sector, Energy & Utilities, Agriculture, Transportation & Logistics, Manufacturing; By Region: North America, LAMEA, Europe, Asia-Pacific) Industry Size, Share, Growth, Trends 2026 to 2035.


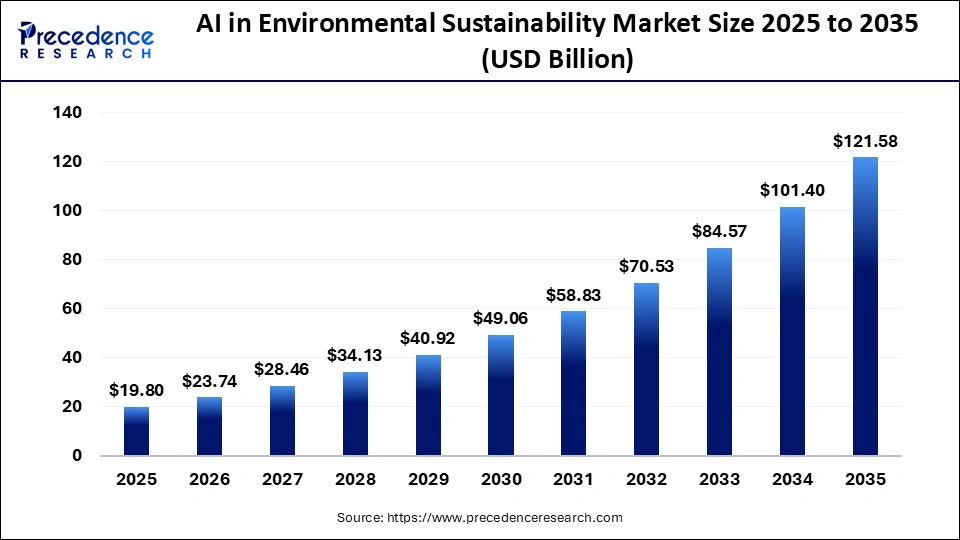
The AI in environmental sustainability market size was estimated at USD 19.80 billion in 2025 and is predicted to increase from USD 23.74 billion in 2026 to approximately USD 121.58 billion by 2035, expanding at A CAGR of 19.9% from 2026 to 2035. Rising global energy demand and increasing government regulations and policies are driving this expansion.
AI in Environmental Sustainability Market Statical Scope
| Reports Attributes | Statistics |
| Market Size in 2025 | USD 19.80 Billion |
| Market Size in 2026 | USD 23.74 Billion |
| Market Size by 2035 | USD 121.58 Billion |
| CAGR 2026 to 2035 | 19.9% |
| Base Year | 2025 |
| Forecast Period | 2026 to 2035 |
The integration of artificial intelligence in sustainability initiatives has emerged as a standard practice among industries that exert significant environmental impact, including energy, utilities, agriculture, transportation, and manufacturing. Organizations are increasingly positioning AI solutions at the core of their sustainability strategies, emphasizing data-driven decision-making and tangible impact. Climate change, resource scarcity, and social equity have ascended to the forefront of global organizational priorities. Governments, investors, and corporations are establishing ambitious goals aimed at reducing emissions, achieving carbon neutrality, preserving biodiversity, and fostering social responsibility.
Once regarded primarily as an effective technological tool, AI is now acknowledged as a pivotal element in advancing sustainability. Through the utilization of AI's capabilities in data analysis, process automation, and system optimization, organizations can transition their sustainability aspirations into actionable results.
Market growth is being bolstered by the escalating urgency to address climate change and the increasing recognition of AI's potential to confront environmental challenges. Intelligent monitoring, predictive analytics, and optimization systems are facilitating more effective resource management and environmental stewardship. Additionally, rising governmental investments in sustainable technologies and environmental initiatives create significant opportunities for AI-powered solutions that align with policy objectives and regulatory compliance.
Industries in the manufacturing, energy, and infrastructure sectors are increasingly linking environmental performance with operational risk. AI platforms are now essential tools for emissions detection, energy optimization, and climate-risk modeling, moving beyond mere optional sustainability features. The convergence of AI, the Internet of Things , and high-resolution environmental data is enhancing predictive accuracy in critical areas such as wildfire behavior, water stress, and biodiversity loss. These advancements yield operational value beyond compliance, thereby accelerating investment. Governmental and environmental agencies are adopting these tools to bolster resilience against climate-related disruptions, thereby minimizing human error and enhancing operational efficiency.
AI in Environmental Sustainability Market Share, By Region, 2025 (%)
| Regions | Shares (%) |
| North America | 39% |
| Europe | 30% |
| Asia-Pacific | 20% |
| Latin America | 5% |
| Middle East & Africa | 6% |
- North America -Dominates with 39% due to the strong presence of AI-driven sustainability initiatives, investment in renewable energy, and policy frameworks supporting environmental protection.
- Europe - Does not dominate with 30%, but Europe is leading in the adoption of AI in sustainability, especially in renewable energy and climate change mitigation efforts.
- Asia-Pacific- Does not dominate with 20%, but rapidly growing economies in the region are increasingly using AI for environmental sustainability, especially in agriculture and urban planning.
- Latin America - Does not dominate with 5%, but growing interest in AI applications for biodiversity conservation and sustainable resource management is emerging.
- Middle East & Africa - Does not dominate with 6%, but AI applications in water resource management, energy optimization, and climate resilience are gaining importance in the region.
AI in Environmental Sustainability Market Share, By Application, 2025 (%)
| Segments | Shares (%) |
| Climate Change Mitigation | 29% |
| Renewable Energy Optimization | 18% |
| Waste Management | 15% |
| Water Resource Management | 10% |
| Biodiversity & Wildlife Monitoring | 8% |
| Precision Agriculture | 12% |
| Air Quality Monitoring | 5% |
| Natural Disaster Prediction & Response | 3% |
- Climate Change Mitigation - Dominates with 29% due to the increasing global focus on using AI to reduce carbon emissions, improve energy efficiency, and promote sustainability practices in response to climate change.
- Renewable Energy Optimization - Gaining momentum with 18% as AI technologies are increasingly integrated into optimizing energy production, storage, and distribution in renewable energy sectors.
- Waste Management - Does not dominate with 15%, though AI's role in improving waste segregation, recycling, and resource recovery continues to grow.
- Water Resource Management - Does not dominate with 10%, but AI's ability to monitor, forecast, and manage water usage is gaining importance in regions facing water scarcity.
- Biodiversity & Wildlife Monitoring - Does not dominate with 8%, yet AI applications in tracking wildlife, biodiversity conservation, and environmental protection are on the rise.
- Precision Agriculture - Does not dominate with 12%, but is increasingly being used for optimizing crop yields, water usage, and soil management in sustainable agriculture.
- Air Quality Monitoring - Does not dominate with 5%, though AI's applications in environmental health and air quality analysis are becoming more significant.
- Natural Disaster Prediction & Response - Does not dominate with 3%, but AI's predictive capabilities for disaster management and response are gaining attention in reducing environmental damage and improving resilience.
AI in Environmental Sustainability Market Share, By Technology, 2025 (%)
| Segments | Shares (%) |
| Machine Learning | 38% |
| Computer Vision | 15% |
| Natural Language Processing | 14% |
| Predictive Analytics | 20% |
| Reinforcement Learning | 13% |
- Machine Learning - Dominates with 38% due to its wide application in analyzing large datasets, forecasting trends, and making decisions in environmental sustainability efforts.
- Computer Vision - Does not dominate with 15%, though it plays a critical role in tasks like wildlife monitoring, deforestation detection, and precision agriculture through image recognition.
- Natural Language Processing- Gaining momentum with 14% as NLP applications in environmental sustainability expand to process large amounts of textual data from environmental reports, policy documents, and social media monitoring.
- Predictive Analytics - Dominates with 20% due to its ability to predict trends, forecast environmental changes, and optimize resource management strategies in real time.
- Reinforcement Learning - Does not dominate with 13%, though it is used for continuous learning and optimization in dynamic environmental systems, such as energy usage and waste management.
AI in Environmental Sustainability Market Share, By End Use, 2025 (%)
| Segments | Shares (%) |
| Government & Public Sector | 35% |
| Energy & Utilities | 25% |
| Agriculture | 15% |
| Transportation & Logistics | 10% |
| Manufacturing | 15% |
- Government & Public Sector - Dominates with 35% due to the government's role in regulating, implementing, and funding sustainability initiatives, making it a key end-user of AI technologies in environmental efforts.
- Energy & Utilities - Gaining momentum with 25% as energy companies increasingly rely on AI to optimize renewable energy sources, improve energy efficiency, and reduce environmental impact.
- Agriculture - Does not dominate with 15%, though precision agriculture and sustainable farming practices powered by AI are growing rapidly.
- Transportation & Logistics - Does not dominate with 10%, but AI applications in improving fuel efficiency, reducing emissions, and optimizing routes are gaining traction.
- Manufacturing - Does not dominate with 15%, though AI is widely used in sustainable manufacturing practices, waste reduction, and optimizing resource consumption.
Top Companies of AI in Environmental Sustainability Market
- Amazon Web Services, Inc.
- Cisco Systems, Inc.
- Google LLC
- Hitachi, Ltd.
- IBM Corporation
- Microsoft
- NVIDIA Corporation
- Oracle Corporation
- Schneider Electric
- Siemens
Segments Covered in the Report
By Application
- Climate Change Mitigation
- Renewable Energy Optimization
- Waste Management
- Water Resource Management
- Biodiversity & Wildlife Monitoring
- Precision Agriculture
- Air Quality Monitoring
- Natural Disaster Prediction & Response
By Technology
- Machine Learning
- Computer Vision
- Natural Language Processing
- Predictive Analytics
- Reinforcement Learning
By End Use
- Government & Public Sector
- Energy & Utilities
- Agriculture
- Transportation & Logistics
- Manufacturing
By Region
- North America
- Europe
- Asia Pacific
- Latin America
- Middle East & Africa
| Application | 2025 | 2026 | 2027 | 2028 | 2029 | 2030 | 2031 | 2032 | 2033 | 2034 | 2035 |
|---|---|---|---|---|---|---|---|---|---|---|---|
| Climate Change Mitigation | 5.74 | 6.84 | 8.14 | 9.69 | 11.54 | 13.74 | 16.35 | 19.47 | 23.17 | 27.58 | 32.83 |
| Renewable Energy Optimization | 3.56 | 4.34 | 5.29 | 6.45 | 7.86 | 9.57 | 11.65 | 14.18 | 17.25 | 20.99 | 25.53 |
| Waste Management | 2.97 | 3.54 | 4.21 | 5.02 | 5.97 | 7.11 | 8.47 | 10.09 | 12.01 | 14.30 | 17.02 |
| Water Resource Management | 1.98 | 2.37 | 2.85 | 3.41 | 4.09 | 4.91 | 5.88 | 7.05 | 8.46 | 10.14 | 12.16 |
| Biodiversity & Wildlife Monitoring | 1.58 | 1.90 | 2.28 | 2.73 | 3.27 | 3.93 | 4.71 | 5.64 | 6.77 | 8.11 | 9.73 |
| Precision Agriculture | 2.38 | 2.85 | 3.42 | 4.10 | 4.91 | 5.89 | 7.06 | 8.46 | 10.15 | 12.17 | 14.59 |
| Air Quality Monitoring | 0.99 | 1.19 | 1.42 | 1.71 | 2.05 | 2.45 | 2.94 | 3.53 | 4.23 | 5.07 | 6.08 |
| Natural Disaster Prediction & Response | 0.59 | 0.71 | 0.85 | 1.02 | 1.23 | 1.47 | 1.76 | 2.12 | 2.54 | 3.04 | 3.65 |
| Technology | 2025 | 2026 | 2027 | 2028 | 2029 | 2030 | 2031 | 2032 | 2033 | 2034 | 2035 |
|---|---|---|---|---|---|---|---|---|---|---|---|
| Machine Learning | 7.52 | 8.96 | 10.68 | 12.73 | 15.16 | 18.06 | 21.52 | 25.64 | 30.54 | 36.38 | 43.33 |
| Computer Vision | 2.97 | 3.56 | 4.26 | 5.10 | 6.11 | 7.32 | 8.77 | 10.51 | 12.58 | 15.07 | 18.06 |
| Natural Language Processing | 2.77 | 3.39 | 4.15 | 5.07 | 6.20 | 7.57 | 9.24 | 11.28 | 13.76 | 16.78 | 20.46 |
| Predictive Analytics | 3.96 | 4.74 | 5.68 | 6.81 | 8.15 | 9.76 | 11.70 | 14.01 | 16.78 | 20.10 | 24.07 |
| Reinforcement Learning | 2.57 | 3.08 | 3.69 | 4.42 | 5.30 | 6.35 | 7.60 | 9.11 | 10.91 | 13.06 | 15.65 |
| End Use | 2025 | 2026 | 2027 | 2028 | 2029 | 2030 | 2031 | 2032 | 2033 | 2034 | 2035 |
|---|---|---|---|---|---|---|---|---|---|---|---|
| Government & Public Sector | 6.93 | 8.25 | 9.83 | 11.71 | 13.94 | 16.60 | 19.77 | 23.53 | 28.02 | 33.36 | 39.72 |
| Energy & Utilities | 4.95 | 6.00 | 7.27 | 8.81 | 10.68 | 12.94 | 15.67 | 18.98 | 22.99 | 27.84 | 33.70 |
| Agriculture | 2.97 | 3.56 | 4.26 | 5.10 | 6.11 | 7.32 | 8.77 | 10.51 | 12.58 | 15.07 | 18.06 |
| Transportation & Logistics | 1.98 | 2.37 | 2.84 | 3.40 | 4.08 | 4.88 | 5.85 | 7.00 | 8.39 | 10.05 | 12.04 |
| Manufacturing | 2.97 | 3.56 | 4.26 | 5.10 | 6.11 | 7.32 | 8.77 | 10.51 | 12.58 | 15.07 | 18.06 |
| Region | 2025 | 2026 | 2027 | 2028 | 2029 | 2030 | 2031 | 2032 | 2033 | 2034 | 2035 |
|---|---|---|---|---|---|---|---|---|---|---|---|
| North America | 7.72 | 9.20 | 10.97 | 13.07 | 15.57 | 18.55 | 22.10 | 26.34 | 31.38 | 37.38 | 44.54 |
| Europe | 5.94 | 7.11 | 8.52 | 10.21 | 12.23 | 14.65 | 17.54 | 21.01 | 25.17 | 30.15 | 36.11 |
| Asia-Pacific | 3.96 | 4.81 | 5.85 | 7.11 | 8.64 | 10.50 | 12.75 | 15.48 | 18.79 | 22.81 | 27.69 |
| Latin America | 0.99 | 1.19 | 1.42 | 1.70 | 2.04 | 2.44 | 2.92 | 3.50 | 4.19 | 5.02 | 6.02 |
| Middle East & Africa | 1.19 | 1.42 | 1.70 | 2.04 | 2.45 | 2.93 | 3.51 | 4.20 | 5.03 | 6.03 | 7.22 |
Research Methodology
Related Databooks
March 2026
April 2026
April 2026
April 2026

 sales@precedenceresearch.com
 +1 804-441-9344
 Download Databook
 Schedule a Meeting