Footwear Market Size is USD 498.79 Billion in 2026
Footwear Market (By Product: Athletic (Running & Walking Shoes, Trekking & Hiking Shoes, Sports Shoes), Non-Athletic (Sneakers, Formal Shoes, Flip-flops, Loafers, Others); By End User: Men, Women, Children.; By Region: North America, Europe, Asia-Pacific, Latin America, Middle East & Africa) Industry Size, Share, Growth, Trends 2026 to 2035.


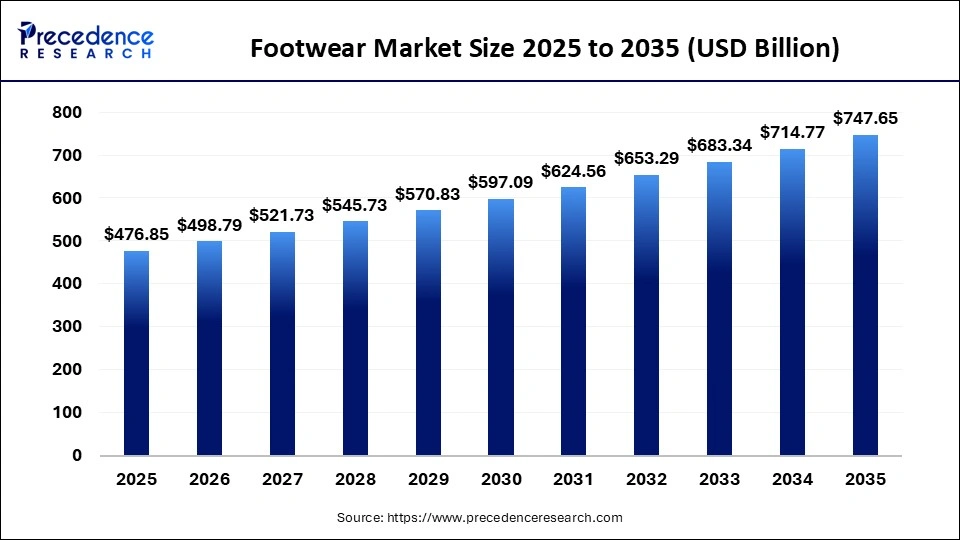
The footwear market size was estimated at USD 476.85 billion in 2025 and is predicted to increase from USD 498.79 billion in 2026 to approximately USD 747.65 billion by 2035, expanding at A CAGR of 4.6% from 2026 to 2035. The global footwear market is experiencing steady growth, driven by rising consumer awareness of fashion, comfort, and performance.
Footwear Market Statical Scope
| Reports Attributes | Statistics |
| Market Size in 2025 | USD 476.85 Billion |
| Market Size in 2026 | USD 498.79 Billion |
| Market Size by 2035 | USD 747.65 Billion |
| CAGR 2026 to 2035 | 4.6% |
| Base Year | 2025 |
| Forecast Period | 2026 to 2035 |
Increasing disposable income and changing lifestyle patterns are encouraging consumers to invest in a variety of footwear, including casual, sports, and formal shoes. The growing popularity of athleisure and fitness activities has significantly boosted demand for athletic footwear, while e-commerce platforms are making products more accessible to a wider audience.
Innovation in materials, such as sustainable and eco-friendly options, is also shaping the market, as consumers become more environmentally conscious. Additionally, leading brands are focusing on product customization, advanced cushioning technologies, and stylish designs to attract diverse consumer groups.
Emerging markets, particularly in the Asia Pacific, are witnessing rapid expansion due to urbanisation and a growing middle-class population. Overall, the footwear market is expected to continue its upward trajectory, supported by evolving fashion trends and technological advancements.
Footwear Market Share, By Region, 2025 (%)
| Regions | Shares (%) |
| North America | 26% |
| Asia Pacific | 34% |
| Europe | 22% |
| Latin America | 10% |
| Middle East & Africa | 8% |
Footwear Market Share, By Type, 2025 (%)
| Segments | Shares (%) |
| Athletic | 12% |
| Trekking & Hiking Shoes | 8% |
| Sports Shoes | 13% |
| Sneakers | 30% |
| Formal Shoes | 15% |
| Flip-flops | 10% |
| Loafers | 7% |
| Others | 5% |
- Athletic – Why it does not dominate: “It accounts for 12% of the market, limited by broader non-athletic footwear demand.”
- Trekking & Hiking Shoes – “It holds 8%, driven by outdoor enthusiasts but niche in overall consumption.”
- Sports Shoes – “It captures 13%, benefiting from sports participation and lifestyle trends.”
- Non-Athletic:
- Sneakers – Why it dominates: “It leads the market with 30% share, driven by casual fashion and daily wear.”
- Formal Shoes – “It holds 15%, supported by workplace and professional demand.”
- Flip-flops – “It captures 10%, favored for leisure and comfort.”
- Loafers – “It represents 7%, popular in business-casual settings.”
- Others – “It accounts for 5%, covering niche or seasonal footwear types.”
Footwear Market Share, By Application, 2025 (%)
| Segments | Shares (%) |
| Men | 41% |
| Women | 49% |
| Children | 10% |
- Men – It drives 41% of consumption, supported by athletic and formal footwear demand.
- Women – It holds 49%, slightly higher than men, led by fashion, casual, and lifestyle segments.
- Children – It represents 10%, constrained by smaller population and lower spending.
Top Companies in the Footwear Market
- Nike, Inc.
- Adidas AG
- Puma SE
- Geox S.p.A
- Timberland
- SKECHERS USA, Inc.
- ECCO Sko A/S
- Crocs Retail, LLC
- Under Armour, Inc.
- Wolverine World Wide, Inc.
Segments Covered in the Report
By Product
- Athletic
- Running & Walking Shoes
- Trekking & Hiking Shoes
- Sports Shoes
- Non-Athletic
- Sneakers
- Formal Shoes
- Flip-flops
- Loafers
- Others
By End User
- Men
- Women
- Children
By Regional
- North America
- U.S.
- Canada
- Mexico
- Europe
- Germany
- UK
- France
- Italy
- Spain
- Asia Pacific
- China
- Japan
- India
- South Korea
- Australia
- Latin America
- Brazil
- Middle East & Africa
- South Africa
| Product | 2025 | 2026 | 2027 | 2028 | 2029 | 2030 | 2031 | 2032 | 2033 | 2034 | 2035 |
|---|---|---|---|---|---|---|---|---|---|---|---|
| Running & Walking Shoes | 85.83 | 90.78 | 96.00 | 101.51 | 107.32 | 113.45 | 119.91 | 126.74 | 133.93 | 141.52 | 149.53 |
| Trekking & Hiking Shoes | 33.38 | 35.41 | 37.56 | 39.84 | 42.24 | 44.78 | 47.47 | 50.30 | 53.30 | 56.47 | 59.81 |
| Sports Shoes | 71.53 | 75.82 | 80.35 | 85.13 | 90.19 | 95.53 | 101.18 | 107.14 | 113.43 | 120.08 | 127.10 |
| Sneakers | 95.37 | 100.75 | 106.43 | 112.42 | 118.73 | 125.39 | 132.41 | 139.80 | 147.60 | 155.82 | 164.48 |
| Formal Shoes | 66.76 | 68.83 | 70.96 | 73.13 | 75.35 | 77.62 | 79.94 | 82.31 | 84.73 | 87.20 | 89.72 |
| Flip-flops | 47.69 | 49.38 | 51.13 | 52.94 | 54.80 | 56.72 | 58.71 | 60.76 | 62.87 | 65.04 | 67.29 |
| Loafers | 38.15 | 39.40 | 40.69 | 42.02 | 43.38 | 44.78 | 46.22 | 47.69 | 49.20 | 50.75 | 52.34 |
| Others | 38.15 | 38.41 | 38.61 | 38.75 | 38.82 | 38.81 | 38.72 | 38.54 | 38.27 | 37.88 | 37.38 |
| End User | 2025 | 2026 | 2027 | 2028 | 2029 | 2030 | 2031 | 2032 | 2033 | 2034 | 2035 |
|---|---|---|---|---|---|---|---|---|---|---|---|
| Men | 238.43 | 248.39 | 258.78 | 269.59 | 280.85 | 292.57 | 304.78 | 317.50 | 330.74 | 344.52 | 358.87 |
| Women | 166.90 | 176.07 | 185.74 | 195.92 | 206.64 | 217.94 | 229.84 | 242.37 | 255.57 | 269.47 | 284.11 |
| Children | 71.53 | 74.32 | 77.22 | 80.22 | 83.34 | 86.58 | 89.94 | 93.42 | 97.03 | 100.78 | 104.67 |
| Region | 2025 | 2026 | 2027 | 2028 | 2029 | 2030 | 2031 | 2032 | 2033 | 2034 | 2035 |
|---|---|---|---|---|---|---|---|---|---|---|---|
| North America | 133.52 | 138.66 | 144.00 | 149.53 | 155.27 | 161.21 | 167.38 | 173.77 | 180.40 | 187.27 | 194.39 |
| Europe | 119.21 | 123.70 | 128.35 | 133.16 | 138.14 | 143.30 | 148.64 | 154.18 | 159.90 | 165.83 | 171.96 |
| Asia Pacific | 143.06 | 151.63 | 160.69 | 170.27 | 180.38 | 191.07 | 202.36 | 214.28 | 226.87 | 240.16 | 254.20 |
| Latin America | 47.69 | 49.38 | 51.13 | 52.94 | 54.80 | 56.72 | 58.71 | 60.76 | 62.87 | 65.04 | 67.29 |
| Middle East & Africa | 33.38 | 35.41 | 37.56 | 39.84 | 42.24 | 44.78 | 47.47 | 50.30 | 53.30 | 56.47 | 59.81 |
Research Methodology
Related Databooks
April 2026
April 2026
April 2026
April 2026

 sales@precedenceresearch.com
 +1 804-441-9344
 Download Databook
 Schedule a Meeting