North America Awnings Market Size is USD 3.92 Billion in 2026
North America Awnings Market (By Product: Retractable, Stationary; By Application: Residential, Commercial) Industry Size, Share, Growth, Trends 2026 to 2035.


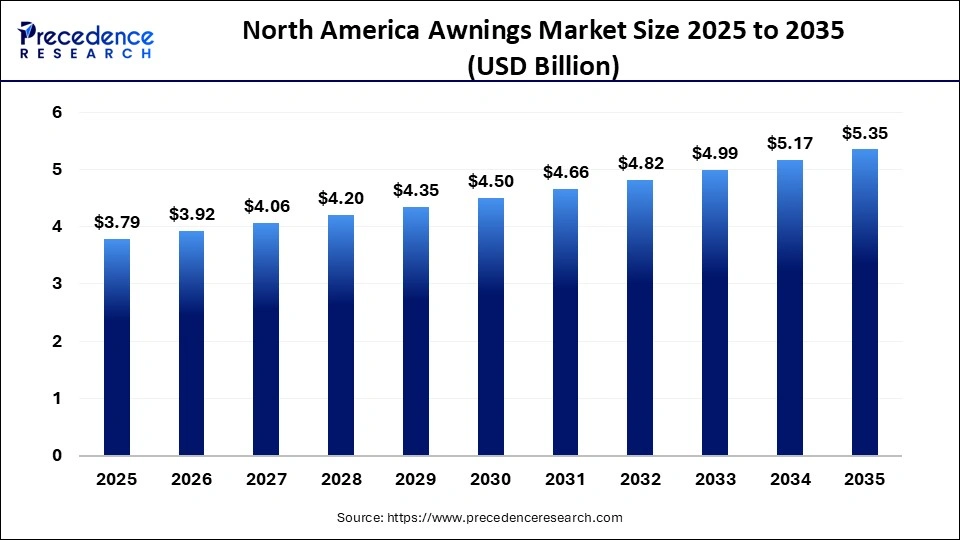
The North America awnings market size was estimated at USD 3.79 billion in 2025 and is predicted to increase from USD 3.92 billion in 2026 to approximately USD 5.35 billion by 2035, expanding at A CAGR of 3.5% from 2026 to 2035. The market is significant, driven by the demand for year-round outdoor living spaces and energy-efficient smart home solutions.
North America Awnings Market Statical Scope
| Reports Attributes | Statistics |
| Market Size in 2025 | USD 3.79 Billion |
| Market Size in 2026 | USD 3.92 Billion |
| Market Size by 2035 | USD 5.35 Billion |
| CAGR 2026 to 2035 | 3.5% |
| Base Year | 2025 |
| Forecast Period | 2026 to 2035 |
Growth is fueled by home renovations, urbanization needing shaded areas, and the hospitality industry's expansion. The rise of motorized and retractable technology also impacts the market. Homeowners are investing in upgrades for patios, balconies, and decks, increasing demand for residential awnings. In the U.S. and Canada, awnings are vital for energy savings, providing shade, reducing cooling costs, and protecting against UV rays.
The market is embracing motorization, remote controls, and smart sensors for enhanced comfort, particularly in upscale homes. Restaurants, cafes, and hotels use awnings to expand seating and improve aesthetics, crucial for customer capacity and branding in urban areas. The region's diverse climate necessitates protection from sun and rain, while urbanization calls for better use of small outdoor spaces. The U.S. holds the largest market share, experiencing growth through residential renovations and outdoor hospitality development.
North America Awnings Market, By Country in 2025 (%)
- U.S. – The market is driven by the rising outdoor living areas, energy efficiency, and smart, motorized technology. Homeowners are motivated to increase property value, the hospitality sector is expanding, and there is a trend towards sustainable materials.
- Canada – The Canadian awnings market is mainly driven by the growing demand for better outdoor living spaces, especially for residential patios and decks. More consumers are becoming aware of energy efficiency, and there is a need for strong, weather-resistant materials to withstand the tough Canadian climate.
- Mexico – The Mexican awnings market is growing due to the increasing need for energy-efficient solutions, the growth of the hospitality and retail sectors, and the use of smart, motorized technologies.
North America Awnings Market Share, By Product, 2025 (%)
| Segments | Shares (%) |
| Retractable | 79% |
| Stationary | 21% |
-
Retractable - This segment leads with 79% market share because of its flexibility, user-friendliness, and capacity to adapt to weather changes, making it a top choice for contemporary homes and businesses.
-
Stationary – This segment holds with 21% market share, as it is inflexible and less adaptable than retractable options, yet it is still utilized for permanent setups.
North America Awnings Market Share, By Application, 2025 (%)
| Segments | Shares (%) |
| Residential | 68% |
| Commercial | 32% |
- Residential - This segment leads with 68% market share due to the growing interest in outdoor living areas, home improvement trends, and the necessity for sun protection in patios and balconies.
- Commercial - This segment holds 32% market share, as it plays an important role in places like storefronts, restaurants, and cafes for branding and shading needs.
Top Companies in the North America Awnings Market
- SunSetter Products
- Advanced Design Awnings & Signs
- Sunair Awnings
- Awning Company of America, Inc.
- Carroll Architectural Shade
- Eide Industries, Inc.
- NuImage Awnings / Futureguard
- KE USA Inc. (Durasol Awnings, Inc.)
- Aristocrat Awnings
- Marygrove Awnings
Segments Covered in the Report
By Product
- Retractable
- Stationary
By Application
- Residential
- Commercial
| Application | 2025 | 2026 | 2027 | 2028 | 2029 | 2030 | 2031 | 2032 | 2033 | 2034 | 2035 |
|---|---|---|---|---|---|---|---|---|---|---|---|
| Residential | 2.58 | 2.66 | 2.74 | 2.82 | 2.90 | 2.99 | 3.07 | 3.16 | 3.25 | 3.33 | 3.47 |
| Commercial | 1.21 | 1.27 | 1.32 | 1.38 | 1.45 | 1.51 | 1.58 | 1.66 | 1.74 | 1.83 | 1.87 |
| Product | 2025 | 2026 | 2027 | 2028 | 2029 | 2030 | 2031 | 2032 | 2033 | 2034 | 2035 |
|---|---|---|---|---|---|---|---|---|---|---|---|
| Retractable | 2.99 | 3.08 | 3.18 | 3.27 | 3.36 | 3.46 | 3.55 | 3.65 | 3.75 | 3.85 | 4.06 |
| Stationary | 0.80 | 0.84 | 0.88 | 0.93 | 0.99 | 1.04 | 1.10 | 1.17 | 1.24 | 1.32 | 1.28 |
Research Methodology
Related Databooks
April 2026
April 2026
April 2026
April 2026

 sales@precedenceresearch.com
 +1 804-441-9344
 Download Databook
 Schedule a Meeting