North America Drinkware Market Size is USD 741 Billion in 2026
North America Drinkware Market (By Product: Glasses, Cups & Mugs, Water Bottles, Tumblers, Thermos and Flasks, Others; By Size Outlook: Small (8 to 12 oz), Medium (16 to 20 oz), Large (24 to 32 oz), XL (40 oz & Above); By Intake Type Outlook: Straw Lid, Spout Lid/Chug Cap, Sip Lid, Wide-Mouth Opening, Dual Intake, Narrow-Mouth Opening, Others; By Material Outlook: Glass, Ceramic, Plastic, Metal, Others; By Distribution Channel Outlook: Supermarkets & Hypermarkets, Convenience Stores, Specialty Stores, Online/E-Commerce, Others) Industry Size, Share, Growth, Trends 2026 to 2035.


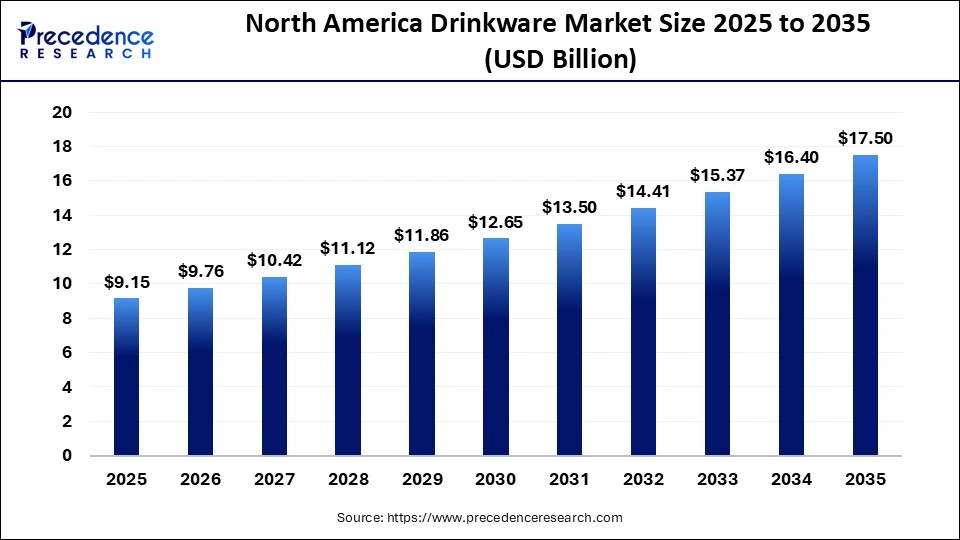
The North America drinkware market size was estimated at USD 9.15 billion in 2025 and is predicted to increase from USD 9.76 billion in 2026 to approximately USD 17.50 billion by 2035, expanding at A CAGR of 6.7% from 2026 to 2035. Trends are leaning towards premium stainless-steel bottles, tumblers, and eco-friendly materials.
North America Drinkware Market Statical Scope
| Reports Attributes | Statistics |
| Market Size in 2025 | USD 9.15 Billion |
| Market Size in 2026 | USD 9.76 Billion |
| Market Size by 2035 | USD 17.50 Billion |
| CAGR 2026 to 2035 | 6.7% |
| Base Year | 2025 |
| Forecast Period | 2026 to 2035 |
The North America drinkware market is seeing a strong demand for products that are durable, insulated, and sustainable. As environmental awareness grows, there is a shift from single-use plastics to more durable options such as stainless steel and glass. Vacuum-insulated tumblers, mugs, and bottles are favored by many consumers on the go. Aesthetic appeal, functionality, and brand reputation are becoming more important, with brands like Yeti, Stanley, and Hydro Flask at the forefront with their premium products.
There is also an increasing demand from cafés and restaurants for high-quality branded drinkware, which is boosting the popularity of tumblers and traditional water bottles. Key players in the North American market include Yeti Coolers, LLC, Stanley, Starbucks, Hydro Flask, Simple Modern, Contigo Brands, Thermos L.L.C., and CamelBak.
In the U.S., the market is fueled by a strong demand for premium, insulated, and eco-friendly products, backed by high consumer spending and a lively café culture featuring chains like Starbucks and Tim Hortons. The move towards sustainability is driving the need for durable, reusable alternatives to single-use plastics, with a growing interest in eco-friendly materials like bamboo, glass, and sustainable plastics.
Customized mugs and tumblers are also becoming more popular, along with wellness trends that encourage carrying healthy drinks like teas and smoothies . Aesthetic appeal continues to be a crucial factor in consumer decisions.
The Canadian market is influenced by a strong consumer preference for sustainable, durable, and reusable items such as stainless steel, glass, and BPA-free choices. Key factors include growing environmental awareness, a move away from single-use plastics, and a high demand for insulated mugs and tumblers. Canada leads in thermos drinkware revenue, with stainless steel bottles at the forefront and Tritan bottles rapidly gaining popularity due to their eco-friendliness.
There is a high demand for reusable water bottles, travel mugs, and tumblers, with supermarkets and hypermarkets dominating sales, while online platforms are expanding quickly due to their convenience. The market thrives on active lifestyles, the need for sustainable materials, and the growing cafe and hospitality industry. An increase in outdoor activities and on-the-go beverage consumption, particularly coffee and tea, is driving the demand for durable drinkware. Regulatory efforts aimed at reducing single-use plastic waste further bolster the sustainable drinkware market.
In Mexico, the thermos drinkware segment is experiencing rapid growth, fueled by the demand for premium insulated stainless-steel bottles and tumblers from brands like Stanley and Yeti. The rise of coffee culture, wellness trends encouraging hydration, and concerns about single-use plastics are shifting consumer preferences towards durable, insulated products. Sales primarily occur through specialized retailers, online platforms, and supermarkets that offer premium options. The market is trending towards premium, customized, and design-oriented products, especially vacuum-insulated stainless steel.
North America Drinkware Market Share, By Product, 2025 (%)
| Segments | Shares (%) |
| Glasses | 15% |
| Cups & Mugs | 10% |
| Water Bottles | 40% |
| Tumblers | 12% |
| Thermos and Flasks | 8% |
| Others | 15% |
- Glasses - Does not dominate with 15%, but they are a staple in many households and eateries, though less versatile compared to other drinkware products.
- Cups & Mugs - Does not dominate with 10%, but cups and mugs are essential in both homes and offices, representing a significant part of the drinkware market.
- Water Bottles - Dominates with 40% due to the increasing consumer focus on hydration, health, and sustainability, with reusable water bottles becoming a must-have for both on-the-go and daily use.
- Tumblers - Gaining momentum with 12% as consumers seek versatile, portable, and stylish drinkware for daily use, especially in travel mugs and portable tumblers.
- Thermos and Flasks - Does not dominate with 8%, but still maintains a niche in the market, especially for hot beverages and outdoor use.
- Others - Does not dominate with 15%, representing niche or seasonal products in the drinkware market.
North America Drinkware Market Share, By Size Outlook, 2025 (%)
| Segments | Shares (%) |
| Small (8 to 12 oz) | 20% |
| Medium (16 to 20 oz) | 25% |
| Large (24 to 32 oz) | 40% |
| XL (40 oz & Above) | 15% |
- Small (8 to 12 oz) - Does not dominate with 20%, though smaller sizes are preferred for children's drinkware or specific beverage needs.
- Medium (16 to 20 oz) - Does not dominate with 25%, but medium-sized drinkware is the most common size for daily use, offering a balanced volume.
- Large (24 to 32 oz) - Dominates with 40% due to the increasing demand for larger capacity drinkware, particularly for beverages consumed in larger quantities (e.g., water, iced drinks).
- XL (40 oz & Above) - Does not dominate with 15%, but gaining traction as larger drinkware is becoming popular for gym-goers and those prioritizing hydration.
North America Drinkware Market Share, By Intake Type Outlook, 2025 (%)
| Segments | Shares (%) |
| Straw Lid | 50% |
| Spout Lid/Chug Cap | 20% |
| Sip Lid | 25% |
| Wide-Mouth Opening | 5% |
| Dual Intake | |
| Narrow-Mouth Opening | |
| Others |
- Straw Lid - Dominates with 25% due to the convenience and versatility of the straw lid, which is widely used in water bottles and tumblers.
- Spout Lid/Chug Cap- Does not dominate with 15%, but preferred by some consumers for faster drinking, especially for those on the move.
- Sip Lid - Does not dominate with 10%, though it remains a popular choice in certain beverage containers, particularly for hot drinks.
- Wide-Mouth Opening - Does not dominate with 20%, but offers a convenient option for people who prefer easy filling, cleaning, and pouring.
Dual Intake - Dual Intake - Gaining momentum with 15% as the dual intake feature combines multiple intake methods for added convenience, catering to different drinking preferences.
- Narrow-Mouth Opening - Does not dominate with 10%, but suitable for some users who prefer a more controlled flow for beverages like coffee or tea.
- Others - Does not dominate with 5%, but covers various niche intake options.
North America Drinkware Market Share, By Material Outlook, 2025 (%)
| Segments | Shares (%) |
| Glass | 10% |
| Ceramic | 8% |
| Plastic | 10% |
| Metal | 66% |
| Others | 6% |
- Glass - Does not dominate with 10%, though glass drinkware is valued for its aesthetic appeal, premium feel, and safety for specific types of beverages.
- Ceramic - Does not dominate with 8%, but ceramic is a popular material for mugs and cups, often used for hot beverages.
- Plastic - Does not dominate with 10%, but plastic remains an affordable and durable material for everyday use, particularly in water bottles.
- Metal - Dominates with 66% due to the growing preference for stainless steel and insulated metal drinkware, valued for durability, temperature retention, and eco-friendliness.
- Others - Does not dominate with 6%, representing other specialty materials used in drinkware products.
North America Drinkware Market Share, By Distribution Channel Outlook, 2025 (%)
| Segments | Shares (%) |
| Supermarkets & Hypermarkets | 38% |
| Convenience Stores | 12% |
| Specialty Stores | 10% |
| Online/E-Commerce | 25% |
| Others | 15% |
- Supermarkets & Hypermarkets - Dominates with 38% due to their wide reach and product variety, offering drinkware in convenient retail locations.
- Convenience Stores - Does not dominate with 12%, but plays an important role in offering on-the-go drinkware for quick purchases.
- Specialty Stores - Does not dominate with 10%, but specialty stores cater to niche markets, particularly premium or unique drinkware products.
- Online/E-Commerce - Gaining momentum with 25% as e-commerce platforms provide convenience, a wider selection, and the ability to shop from home.
- Others - Does not dominate with 15%, representing smaller or regional channels, including direct-to-consumer or wholesale distribution.
Top Companies of North America Drinkware:
- Owala (Trove)
- Stanley
- Yeti Coolers
- Simple Modern
- Zak Designs
- Cirkul
- Blender Bottle (Trove)
- HydroJug
- Hydro Flask
- Contigo
- Reduce
- Thermos
- Ello
- Starbucks
- Gatorade
- BruMate
Segments Covered in the Report
By Product
- Glasses
- Cups & Mugs
- Water Bottles
- Tumblers
- Thermos and Flasks
- Others
By Size
- Small (8 to 12 oz)
- Medium (16 to 20 oz)
- Large (24 to 32 oz)
- XL (40 oz & Above)
By Intake Type
- Straw Lid
- Spout Lid/Chug Cap
- Sip Lid
- Wide-Mouth Opening
- Dual Intake
- Narrow-Mouth Opening
- Others
By Material
- Glass
- Ceramic
- Plastic
- Metal
- Others
By Distribution Channel
- Supermarkets & Hypermarkets
- Convenience Stores
- Specialty Stores
- Online/E-Commerce
- Others
| Product | 2025 | 2026 | 2027 | 2028 | 2029 | 2030 | 2031 | 2032 | 2033 | 2034 | 2035 |
|---|---|---|---|---|---|---|---|---|---|---|---|
| Glasses | 1.37 | 1.46 | 1.54 | 1.63 | 1.73 | 1.84 | 1.94 | 2.06 | 2.18 | 2.31 | 2.45 |
| Cups & Mugs | 0.92 | 0.97 | 1.03 | 1.10 | 1.16 | 1.23 | 1.31 | 1.39 | 1.48 | 1.57 | 1.66 |
| Water Bottles | 3.66 | 3.90 | 4.16 | 4.43 | 4.72 | 5.03 | 5.36 | 5.71 | 6.09 | 6.49 | 6.91 |
| Tumblers | 1.10 | 1.19 | 1.29 | 1.40 | 1.52 | 1.65 | 1.78 | 1.93 | 2.09 | 2.26 | 2.45 |
| Thermos & Flasks | 0.73 | 0.78 | 0.84 | 0.90 | 0.96 | 1.03 | 1.10 | 1.18 | 1.27 | 1.36 | 1.45 |
| Others | 1.37 | 1.46 | 1.56 | 1.66 | 1.77 | 1.88 | 2.00 | 2.13 | 2.27 | 2.42 | 2.57 |
| Material | 2025 | 2026 | 2027 | 2028 | 2029 | 2030 | 2031 | 2032 | 2033 | 2034 | 2035 |
|---|---|---|---|---|---|---|---|---|---|---|---|
| Glass | 0.92 | 0.98 | 1.05 | 1.12 | 1.20 | 1.28 | 1.38 | 1.47 | 1.57 | 1.69 | 1.80 |
| Ceramic | 0.73 | 0.78 | 0.84 | 0.90 | 0.96 | 1.03 | 1.10 | 1.17 | 1.25 | 1.34 | 1.44 |
| Plastic | 0.92 | 0.97 | 1.02 | 1.08 | 1.14 | 1.20 | 1.27 | 1.34 | 1.41 | 1.49 | 1.58 |
| Metal | 6.04 | 6.46 | 6.91 | 7.39 | 7.90 | 8.45 | 9.03 | 9.66 | 10.33 | 11.05 | 11.81 |
| Others | 0.55 | 0.58 | 0.60 | 0.63 | 0.66 | 0.70 | 0.73 | 0.76 | 0.80 | 0.84 | 0.88 |
Research Methodology
Related Databooks
April 2026
April 2026
April 2026
April 2026

 sales@precedenceresearch.com
 +1 804-441-9344
 Download Databook
 Schedule a Meeting