U.S. Flavors Market Size is USD 4.30 Billion in 2026
U.S. Flavors Market (By Application: Food, Beverages, Others; By Nature: Natural, Synthetic; By Form: Powder, Liquid/Gel; By End User: Established National Brands, Private Label Brands, Emerging Brands, Foodservice Industry) Industry Size, Share, Growth, Trends 2026 to 2035.


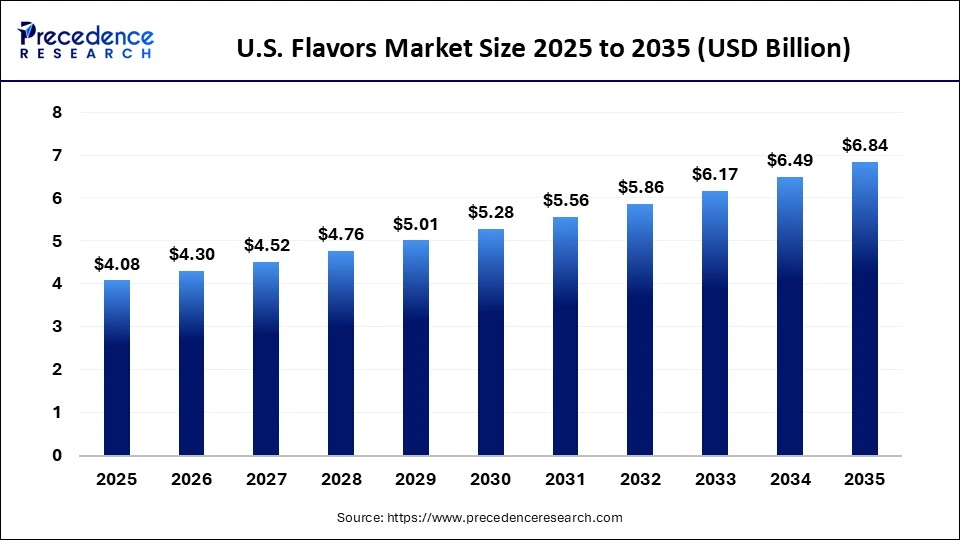
The U.S. flavors market size was estimated at USD 4.08 billion in 2025 and is predicted to increase from USD 4.30 billion in 2026 to approximately USD 6.84 billion by 2035, expanding at a CAGR of 5.3% from 2026 to 2035. Growing demand for unique and memorable taste experiences is driving the U.S. flavors market.
U.S. Flavors Market Statical Scope
| Reports Attributes | Statistics |
| Market Size in 2025 | USD 4.08 Billion |
| Market Size in 2026 | USD 4.30 Billion |
| Market Size by 2035 | USD 6.84 Billion |
| CAGR 2026 to 2035 | 5.3% |
| Base Year | 2025 |
| Forecast Period | 2026 to 2035 |
The importance of the U.S. flavors market lies in its vital role in the food sector, where flavor is crucial for consumer satisfaction and brand differentiation. The market is highly competitive and innovative, as companies strive to create unique flavor profiles that cater to evolving consumer preferences and emerging trends. The growth of the food processing industry, coupled with increased demand for ready-to-eat and convenience foods, highlights the significance of this market.
In the U.S., the rising consumer demand for natural and organic food items is driving the demand for food flavors. Health-conscious consumers are increasingly seeking clean-label options, and FDA guidelines promoting transparency in the labeling of natural flavors also contribute to this trend. Additionally, the growth of convenience foods and the busy lifestyles of consumers further fuel the need for flavorful processed foods.
U.S. Flavors Market Share, By Application, 2025 (%)
| Segments | Shares (%) |
| Food | 66% |
| Beverages | 24% |
| Others | 10% |
- Food- The food segment commands a 66% market share, establishing it as the principal application area for flavors within processed, packaged, and convenience foods. This position ensures a consistent, large-scale demand throughout the industry.
- Beverages- The beverages segment accounts for a 24% share and is experiencing growth, driven by an increasing consumption of flavored, functional, and ready-to-drink products, particularly among health-conscious consumers.
- Others- The others segment, encompassing niche applications beyond the core food and beverage categories, holds a 10% share, which limits its overall market penetration.
U.S. Flavors Market Share, By Nature, 2025 (%)
| Segments | Shares (%) |
| Synthetic | 66% |
| Natural | 34% |
- Synthetic- The synthetic flavors segment is the dominant category, representing a 66% share. This dominance is attributed to factors such as cost efficiency, extended shelf stability, and the ability to deliver consistent taste profiles at an industrial scale.
- Natural- The natural flavors comprise a 34% share and are gaining traction as consumer preferences increasingly favor clean-label, organic, and naturally sourced ingredients in food and beverages.
U.S. Flavors Market Share, By Form, 2025 (%)
| Segments | Shares (%) |
| Powder | 67% |
| Liquid/Gel | 33% |
- Powder- The powder form of flavors leads the market with a 67% share, attributable to its superior stability, ease of storage, and longer shelf life, which facilitates its widespread use in large-scale food manufacturing processes.
- Liquid/gel- The liquid and gel flavors account for 33% share and are becoming more popular due to their superior blending efficiency and enhanced flavor delivery, notably in beverages and dairy applications.
U.S. Flavors Market Share, By End User, 2025 (%)
| Segments | Shares (%) |
| Established National Brands | 48% |
| Emerging Brands | 16% |
| Foodservice Industry | 18% |
| Private Label Brands | 18% |
- Established National Brands- The established national brands segment dominates the market with a 48% share, benefiting from strong brand recognition, extensive distribution networks, and consistent consumer trust across various regions.
- Emerging brands- The emerging brands segment captures a 16% share and is gaining momentum through innovation, niche positioning, and an increasing consumer demand for unique and differentiated flavor profiles.
- Foodservice Industry- The foodservice industry holds an 18% share, primarily influenced by an increase in out-of-home consumption patterns.
- Private Label Brands- Private label brands also account for an 18% share, relying on retailer-driven sales while facing limited brand loyalty in comparison to established national competitors.
Top Companies in the U.S. Flavors Market
- Givaudan S.A.
- DSM-Firmenich AG
- Symrise AG
- Sensient Technologies Corporation
- International Flavors & Fragrances Inc.
- Takasago International Corporation
- Kerry Group plc
- Archer Daniels Midland Company
- Corbion N.V.
- McCormick & Company, Inc.
Segments Covered in the Report
By Application
- Food
- Dairy Products
- Bakery & Confectionery
- Supplements & Nutrition Products
- Meat & Seafood Products
- Snacks
- Pet Foods
- Sauces, Dressings & Condiments
- Others (plant-based food, baby food)
- Beverages
- Juices & Juice Concentrates
- Functional Beverages
- Alcoholic Beverages
- Carbonated Soft Drinks
- Others (Smoothies, Coffee)
- Others
By Nature
- Natural
- Synthetic
By Form
- Powder
- Liquid/Gel
By End User
- Established National Brands
- Private Label Brands
- Emerging Brands
- Foodservice Industry
| Nature | 2025 | 2026 | 2027 | 2028 | 2029 | 2030 | 2031 | 2032 | 2033 | 2034 | 2035 |
|---|---|---|---|---|---|---|---|---|---|---|---|
| Natural | 1.39 | 1.48 | 1.58 | 1.69 | 1.80 | 1.92 | 2.05 | 2.18 | 2.32 | 2.46 | 2.62 |
| Synthetic | 2.69 | 2.82 | 2.94 | 3.07 | 3.20 | 3.33 | 3.46 | 3.58 | 3.72 | 3.85 | 3.98 |
| Form | 2025 | 2026 | 2027 | 2028 | 2029 | 2030 | 2031 | 2032 | 2033 | 2034 | 2035 |
|---|---|---|---|---|---|---|---|---|---|---|---|
| Powder | 2.73 | 2.88 | 3.04 | 3.22 | 3.41 | 3.60 | 3.80 | 4.00 | 4.21 | 4.42 | 4.63 |
| Liquid/Gel | 1.35 | 1.42 | 1.48 | 1.54 | 1.59 | 1.64 | 1.70 | 1.76 | 1.83 | 1.89 | 1.96 |
Research Methodology
Related Databooks
April 2026
April 2026
April 2026
April 2026

 sales@precedenceresearch.com
 +1 804-441-9344
 Download Databook
 Schedule a Meeting