Middle East Commercial Outdoor Furniture Market Size is USD 1,042.78 Million in 2026
Middle East Commercial Outdoor Furniture Market (By Product: Seating Sets, Loungers, Dining Sets, Chairs, Table, Others; By End Use: Corporate Offices, Hotels & Hospitality, Multi-Family Housing, Educational Institutions, Senior Living & Care Centers, Others; By Distribution Channel: Direct Sales, Distributors/Wholesalers, Contractors, E-Commerce/Online, Others) Industry Size, Share, Growth, Trends 2026 to 2035.


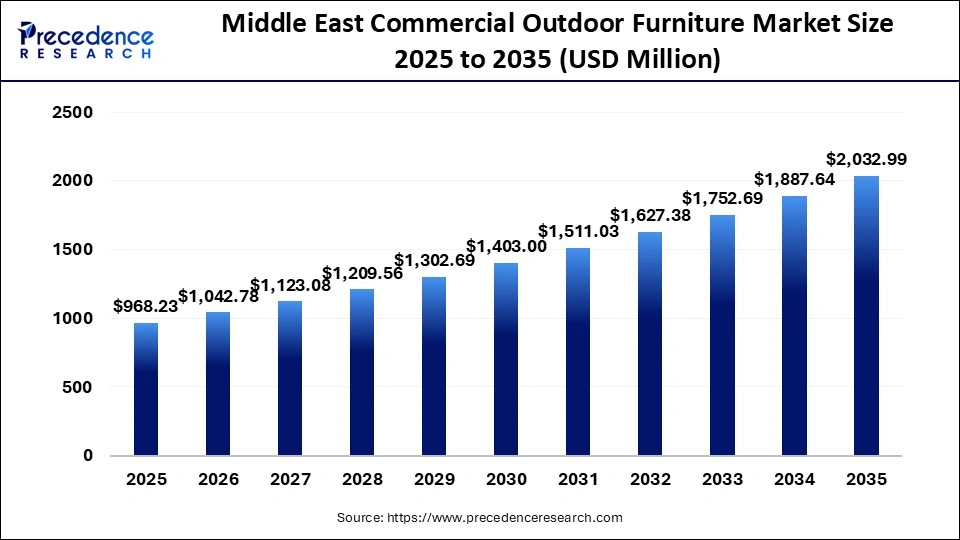
The Middle East commercial outdoor furniture market size was estimated at USD 968.23 million in 2025 and is expanding at a CAGR of 7.70% from 2026 to 2035. This growth is due to the extreme and diverse weather conditions in the region.
Middle East Commercial Outdoor Furniture Market Statical Scope
| Reports Attributes | Statistics |
| Market Size in 2025 | USD 968.23 Million |
| Market Size in 2026 | USD 1,042.78 Million |
| Market Size by 2035 | USD 2,032.99 Million |
| CAGR 2026 to 2035 | 7.70% |
| Base Year | 2025 |
| Forecast Period | 2026 to 2035 |
The Middle East represents a premium, climate-driven commercial outdoor furniture market, primarily supported by hospitality, tourism, and luxury real estate developments. Resorts, hotels, beach clubs, cafés, and restaurants create a strong demand for high-quality, weather-resistant, and UV-protected outdoor furniture.
Factors such as climate conditions, changing lifestyles, and the growing popularity of outdoor leisure spaces have further increased the demand for high-quality furniture. As the region develops, the preference for eco-friendly and sustainable furniture materials, along with modern designs, continues to evolve, attracting global players to expand their presence in the area.
Middle East Commercial Outdoor Furniture Market Share, by country, 2025
- Saudi Arabia - Demand for commercial outdoor furniture in Saudi Arabia is rapidly growing due to several converging factors. The Kingdom's Vision 2030 infrastructure push has spurred large-scale investments in hospitality resorts, luxury residential towers, mixed-use developments, and leisure destinations, thereby driving the development of outdoor amenity spaces.
Middle East Commercial Outdoor Furniture Market Share, By Product, 2025, (%)
| Segments | Shares (%) |
| Seating seats | 22% |
| Dining sets | 20% |
| Chairs | 18% |
| Loungers | 15% |
| Tables | 15% |
| Others | 10% |
- Seating seats- It dominates because of the strong demand for integrated and aesthetic outdoor seating solutions, holding a 22% share in the market.
- Dining sets- It sees strong growth in hospitality and demand for high-quality, durable, and stylish alfresco dining in restaurants, hotels, and cafes, expanding the demand, holding a 20% share.
- Chairs- Rising demand for stylish, durable, and versatile seating is driving this segment and holds 18% share.
- Loungers- Rising investment in luxury, resort-style poolside areas, and rooftop lounges contributes to 15% market share.
Middle East Commercial Outdoor Furniture Market Share, By End Use, 2025, (%)
| Segments | Shares (%) |
| Hotels and hospitality | 30% |
| Corporate offices | 18% |
| Multi-family housing | 16% |
| Senior living and care centers | 14% |
| Educational Institutions | 12% |
| Others | 10% |
- Hotels and hospitality- It leads due to high investment in outdoor aesthetics and guest experience, holding a 30% share in the market.
- Corporate offices- to offer relaxing environments for employees, decreasing stress and increasing productivity, companies are incorporating outdoor furniture and captures 18% share.
- Multi-family housing- Outdoor furniture plays a vital role in boosting a sense of community within multifamily housing complexes, which contributes to 16% share.
- Senior living and care centers- Rising need for specialized, comfortable, and accessible exterior environment for the expanding senior population drives the segment, holding 14% share.
Middle East Commercial Outdoor Furniture Market Share, By Distribution Channel, 2025, (%)
| Segments | Shares (%) |
| Direct sales | 28% |
| Distributors/wholesalers | 26% |
| Contractors | 20% |
| E-commerce/online | 16% |
| Others | 10% |
- Direct sales- It dominates because of bulk procurement and customized solutions for commercial buyers, holding a 28% share.
- Distributors/wholesalers- hospitality, corporate, and public space projects need bulk procurement, which supports the growth of this segment and holds 26% share.
- Contractors- Organizations choose this channel for direct access to manufacturer pricing and bulk discounts that captures 20% share.
- E-commerce/online- These platforms provide B2B buyers with a comprehensive selection of outdoor furniture styles, materials, and brands, all in one place and contributes 16% share.
Top Companies in the Middle East Commercial Outdoor Furniture Market
- Intermetal Furnishings LLC
- A to Z Furniture LLC
- Hevea Outdoor Furniture
- Royse Furniture Industries LLC
- Casualife Furniture
- Elite Style Furniture Co. Ltd
- Kellso Hospitality Furniture UAE
- aRaims Factory (aRaims Group)
- FurnitureRoots
- Alkaffary Group
Segments Covered in the Report
By Product
- Seating Sets
- Loungers
- Dining Sets
- Chairs
- Table
- Others
By End Use
- Corporate Offices
- Hotels & Hospitality
- Multi-Family Housing
- Educational Institutions
- Senior Living & Care Centers
- Others
By Distribution Channel
- Direct Sales
- Distributors/Wholesalers
- Contractors
- E-Commerce/Online
- Others
| Product | 2025 | 2026 | 2027 | 2028 | 2029 | 2030 | 2031 | 2032 | 2033 | 2034 | 2035 |
|---|---|---|---|---|---|---|---|---|---|---|---|
| Seating Sets | 0.42 | 0.34 | 0.42 | 0.42 | 0.37 | 0.37 | 0.33 | 0.41 | 0.45 | 0.40 | 0.39 |
| Loungers | 112.00 | 155.63 | 97.40 | 108.46 | 112.49 | 150.47 | 116.72 | 176.88 | 158.61 | 198.92 | 249.89 |
| Dining Sets | 112.70 | 90.21 | 105.63 | 134.17 | 149.07 | 155.69 | 158.81 | 202.92 | 151.42 | 165.50 | 173.66 |
| Chairs | 182.06 | 229.05 | 237.41 | 227.09 | 259.64 | 290.15 | 351.33 | 337.98 | 263.98 | 328.54 | 399.06 |
| Table | 89.78 | 121.86 | 84.85 | 93.77 | 183.57 | 115.93 | 201.20 | 125.55 | 158.18 | 231.55 | 225.13 |
| Others | 63.34 | 88.05 | 129.32 | 136.27 | 112.83 | 172.76 | 187.55 | 109.85 | 224.77 | 213.30 | 186.39 |
| End Use | 2025 | 2026 | 2027 | 2028 | 2029 | 2030 | 2031 | 2032 | 2033 | 2034 | 2035 |
|---|---|---|---|---|---|---|---|---|---|---|---|
| Corporate Offices | 0.22 | 0.25 | 0.22 | 0.18 | 0.25 | 0.24 | 0.26 | 0.26 | 0.23 | 0.19 | 0.19 |
| Hotels & Hospitality | 375.08 | 422.96 | 412.42 | 542.97 | 501.17 | 502.77 | 592.04 | 698.05 | 701.67 | 740.45 | 786.73 |
| Multi-Family Housing | 82.95 | 68.82 | 146.92 | 149.79 | 118.46 | 169.76 | 235.40 | 143.81 | 234.46 | 251.87 | 276.50 |
| Educational Institutions | 104.16 | 103.44 | 116.64 | 84.02 | 132.88 | 102.92 | 95.55 | 122.76 | 106.50 | 177.13 | 226.57 |
| Senior Living & Care Centers | 104.78 | 103.14 | 66.45 | 88.17 | 118.76 | 133.34 | 86.18 | 107.66 | 123.69 | 185.05 | 198.00 |
| Others | 87.38 | 85.31 | 129.96 | 131.49 | 110.62 | 159.84 | 115.10 | 128.51 | 189.34 | 165.19 | 165.20 |
Research Methodology
Related Databooks
April 2026
April 2026
April 2026
April 2026

 sales@precedenceresearch.com
 +1 804-441-9344
 Download Databook
 Schedule a Meeting