Middle East Polymer Market Size is USD 170.2 Million in 2026
Middle East Polymer Market (By Product: EVOH, HDPE, LDPE, EPDM, PVC, Others) Industry Size, Share, Growth, Trends 2026 to 2035.


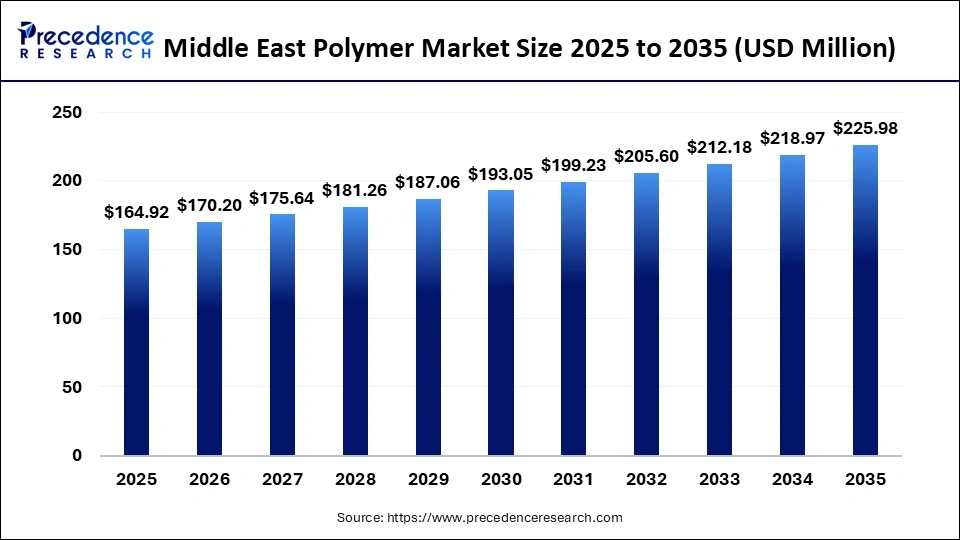
The Middle East polymer market size was estimated at USD 164.92 million in 2025 and is expanding at a CAGR of 3.2% from 2026 to 2035. Due to rising industrialization, infrastructure expansion, and increasing demand from the packaging and automotive sectors, advancements in specialty polymers and sustainable materials are supporting innovation and long-term market development.
Middle East Polymer Market Statical Scope
| Reports Attributes | Statistics |
| Market Size in 2025 | USD 164.92 Million |
| Market Size in 2026 | USD 170.2 Million |
| Market Size by 2035 | USD 225.98 Million |
| CAGR 2026 to 2035 | 3.2% |
| Base Year | 2025 |
| Forecast Period | 2026 to 2035 |
Technological advancements are significantly shaping the Middle East polymer market by enhancing production efficiency and material performance. Innovations such as advanced polymerization recycling techniques are gaining traction. The adoption of automation and digital manufacturing is also improving quality and reducing costs.
Additionally, developments in high-performance and specialty polymers are supporting industries like packaging, construction, and automotive, driving overall market expansion in the region.
Middle East Polymer Market Share, By Country, 2025 (%)
- UAE- Due to the petrochemical infrastructure and rising demand from the packaging, construction, and automotive sectors. Government support for industrial diversification and investments in advanced materials is further encouraging innovation and boosting polymer production and consumption across the country.
- Saudi Arabia- Driven by its strong petrochemical base and abundant thieves stoke available availability, growing demand from the packaging, construction, and automotive sectors, along with government initiatives like supporting diversification, innovation, and overall market expansion.
Middle East Polymer Market Share, By Product, 2025 (%)
| Segments | Shares (%) |
| HDPE | 56% |
| LDPE | 15% |
| PVC | 13% |
| EPDM | 10% |
| EVOH | 6% |
- HDPE- The segment dominated the market with a 56% share, driven by high durability, chemical resistance, and widespread use in packaging, piping, and industrial applications across the region.
- LDPE- The segment accounted for 15% of the total market share, due to flexibility, lightweight, and wide use in packaging films, plastic bags, and agricultural applications across the region.
- PVC- The segment accounted for 13% of the total market share. Its growth is supported by strong demand for construction applications such as pipe fittings and cables, driven by ongoing infrastructure and urban development projects across the region.
- EPDM- The segment accounted for 10% of the total market share. Its demand is supported by excellent weather resistance and durability, making it widely used in automotive parts, roofing membranes, and sealing applications across the region.
- EVOH- The segment accounted for 6% of the total market share. Its growth is driven by its superior barrier properties, making it highly suitable for food packaging and pharmaceutical applications requiring extended shelf life and product protection.
Top Companies in the Middle East Polymer Market
- Veolia
- Waste Management Inc.
- SUEZ Recycling & Recovery
- KW Plastics
- Republic Services
- Biffa
- TerraCycle
- Plasgran Ltd
- MBA Polymers
- Remondis SE & Co. KG
Segments Covered in the Report
By Product
- EVOH
- HDPE
- LDPE
- EPDM
- PVC
- Others
Middle East Polymer Market Size, By Product, 2025 to 2035 (USD Million)
| Product | 2025 | 2026 | 2027 | 2028 | 2029 | 2030 | 2031 | 2032 | 2033 | 2034 | 2035 |
|---|---|---|---|---|---|---|---|---|---|---|---|
| EVOH | 8.25 | 8.68 | 9.13 | 9.61 | 10.10 | 10.62 | 11.16 | 11.72 | 12.31 | 12.92 | 13.56 |
| HDPE | 92.36 | 94.97 | 97.66 | 100.42 | 103.26 | 106.18 | 109.18 | 112.26 | 115.43 | 118.68 | 122.03 |
| LDPE | 24.74 | 25.36 | 26.00 | 26.65 | 27.31 | 27.99 | 28.69 | 29.40 | 30.13 | 30.88 | 31.64 |
| EPDM | 9.90 | 10.38 | 10.89 | 11.42 | 11.97 | 12.55 | 13.15 | 13.78 | 14.43 | 15.11 | 15.82 |
| PVC | 21.44 | 22.21 | 23.01 | 23.84 | 24.69 | 25.58 | 26.50 | 27.45 | 28.43 | 29.45 | 30.51 |
| Others | 8.25 | 8.59 | 8.96 | 9.34 | 9.73 | 10.14 | 10.56 | 11.00 | 11.46 | 11.93 | 12.43 |

 sales@precedenceresearch.com
 +1 804-441-9344
 Download Databook
 Schedule a Meeting