Middle East Veterinary Microchips Market Size is USD 75.10 Million in 2026
Middle East Veterinary Microchips Market (By Animal: Dogs, Cats, Horses, Others; By Product: Microchips, Scanner, Handheld Scanners, Stationary Scanners; By Frequency: 134.2 KHz, 125 KHz, 128 KHz, Universal/Multifrequency Devices; By Application: Pet Identification, Disease Tracking & Vaccination Management, Theft Prevention, Others; By Distribution Channel: Veterinary Hospitals/Clinics, Pet Stores/Retail, E-Commerce, Others) Industry Size, Share, Growth, Trends 2026 to 2035


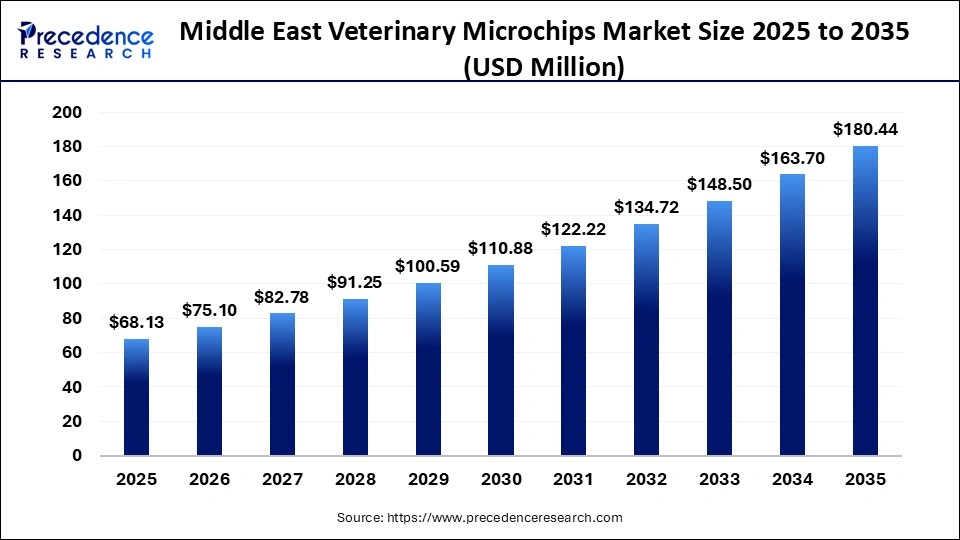
The Middle East veterinary microchips market size was estimated at USD 68.13 million in 2025 and is expanding at a CAGR of 10.23% from 2026 to 2035. The rising pet humanization trend and pet safety are driving the market.
Middle East Veterinary Microchips Market Statical Scope
| Reports Attributes | Statistics |
| Market Size in 2025 | USD 68.13 Million |
| Market Size in 2026 | USD 75.10 Million |
| Market Size by 2035 | USD 180.44 Million |
| CAGR 2026 to 2035 | 10.23% |
| Base Year | 2025 |
| Forecast Period | 2026 to 2035 |
The veterinary microchips market in the Middle East is experiencing significant growth, driven by increasing pet ownership, heightened awareness of animal safety, and technological advancements in microchip design.
The rise in pet populations underscores the need for reliable pet identification systems, as pets are more likely to get lost or separated from their owners. As pet owners become more aware of the benefits of microchipping for lost pet recovery and identification, veterinary microchips have become standard.
Middle East Veterinary Microchips Market Share, By Country, 2025
- Saudi Arabia- The veterinary microchips market in Saudi Arabia is poised for substantial growth, propelled by evolving pet ownership trends, increasing regulatory requirements, and heightened consumer awareness regarding pet identification and safety.
Middle East Veterinary Microchips Market Share, By Animal, 2025 (%)
| Segments | Shares (%) |
| Dogs | 50% |
| Cats | 35% |
| Horses | 15% |
- Dogs- growing dog pet owners and mandatory identification regulations with a 50% share, are the primary segment in the Middle East veterinary microchips market.
- Cats- compulsory pet registration laws in nations like the UAE and initiatives in Saudi Arabia account for 35% share.
- Horses- Equine sport federations in the Middle East, coupled with national mandates, are driving the market growth and holds 15% share.
Middle East Veterinary Microchips Market Share, By Product, 2025 (%)
| Segments | Shares (%) |
| Microchips | 55% |
| Handheld Scanners | 30% |
| Stationery Scanners | 15% |
- Microchips- They drive the core product demand and, with a 55% share, are widely used for identification and tracking.
- Handheld scanners- this segment holds 30% share due to demand for portable and quick identification of animals in shelters and clinics.
- Stationery scanners- their use in veterinary clinics and animal shelter intake facilities is driving their growth with 15% share.
Middle East Veterinary Microchips Market Share, By Frequency, 2025 (%)
| Segments | Shares (%) |
| 134.2 KHz | 40% |
| 125 KHz | 35% |
| 128 KHz | 25% |
- 134.2 KHz- its status as the international ISO 11784/11785 standard for animal identification is driving its demand with 40% share.
- 125 kHz- 125 kHz microchips are preferred for their simple and cost-effective design, and therefore a popular choice for budget-conscious consumers, with 35% share.
- 128 kHz- It is less common and, with a 25% share, represents niche applications.
Middle East Veterinary Microchips Market Share, By Application, 2025 (%)
| Segments | Shares (%) |
| Pet Identification | 60% |
| Disease Tracking & Vaccination Management | 25% |
| Theft Prevention | 15% |
- Pet identification- It drives the largest application demand and, with a 60% share, is fueled by regulatory and owner requirements. spending on preventive care and permanent identification.
- Disease Tracking & Vaccination Management- merging of smart chip technology and growing digital health infrastructure contributes for 25% share.
- Theft prevention- this segment accounts for 15% share due to rising concerns over pet safety and increasing cases of theft, including valuable breeds.
Middle East Veterinary Microchips Market Share, By Distribution Channel, 2025 (%)
| Segments | Shares (%) |
| Veterinary Hospitals/Clinics | 55% |
| Pet Stores/Retail | 25% |
| E-commerce | 20% |
- Veterinary Hospitals/Clinics- They are the primary distribution channel with a 55% share because of their central role in offering, injecting, and registering microchips during routine check-ups and surgeries.
- Pet Stores/Retail- Demand for convenience, and the growth of DIY, breeder, and rescue organizations, boost the growth with 25% share.
- E- commerce- e- commerce segment accounts for 20% share due to increasing online pet retail and customer demand for easy access to diagnostic, identification, and tracking items.
Top Companies in the Middle East Veterinary Microchips Market
- Virbac
- Trovan Ltd
- Avid Identification Systems, Inc.
- Datamars
- Eurovets
- PetData UAE
- GAO RFID
- The Veterinary Group LLC
- Wuxi Fofia Technology Co., Ltd
- Microchipped AE
Segments Covered in the Report
By Animal
- Dogs
- Cats
- Horses
- Others
By Product
- Microchips
- Scanner
- Handheld Scanners
- Stationary Scanners
By Frequency
- 134.2 KHz
- 125 KHz
- 128 KHz
- Universal/Multifrequency Devices
By Application
- Pet Identification
- Disease Tracking & Vaccination Management
- Theft Prevention
- Others
By Distribution Channel
- Veterinary Hospitals/Clinics
- Pet Stores/Retails
- E-Commerce
- Others
| Animal | 2025 | 2026 | 2027 | 2028 | 2029 | 2030 | 2031 | 2032 | 2033 | 2034 | 2035 |
|---|---|---|---|---|---|---|---|---|---|---|---|
| Dogs | 31.88 | 34.70 | 37.75 | 41.06 | 44.76 | 48.78 | 53.16 | 57.93 | 63.27 | 69.11 | 75.48 |
| Cats | 16.76 | 18.62 | 20.70 | 23.00 | 25.55 | 28.38 | 31.53 | 35.02 | 38.91 | 43.23 | 48.03 |
| Horses | 12.88 | 14.49 | 16.31 | 18.34 | 20.62 | 23.28 | 26.15 | 29.37 | 32.97 | 37.01 | 41.53 |
| Others | 6.61 | 7.28 | 8.03 | 8.85 | 9.66 | 10.42 | 11.36 | 12.39 | 13.37 | 14.41 | 15.53 |
| Product | 2025 | 2026 | 2027 | 2028 | 2029 | 2030 | 2031 | 2032 | 2033 | 2034 | 2035 |
|---|---|---|---|---|---|---|---|---|---|---|---|
| Microchips | 39.79 | 43.41 | 47.35 | 51.65 | 56.32 | 61.53 | 67.21 | 73.42 | 80.20 | 87.61 | 95.70 |
| Scanner | 11.79 | 13.14 | 14.65 | 16.33 | 18.20 | 20.29 | 22.61 | 25.19 | 28.07 | 31.28 | 34.85 |
| Handheld Scanners | 9.67 | 10.96 | 12.42 | 14.05 | 15.89 | 17.96 | 20.29 | 22.90 | 25.84 | 29.15 | 32.86 |
| Stationary Scanners | 6.88 | 7.59 | 8.36 | 9.22 | 10.16 | 11.09 | 12.10 | 13.20 | 14.41 | 15.72 | 17.15 |
Research Methodology
Related Databooks
March 2026
March 2026
March 2026
March 2026

 sales@precedenceresearch.com
 +1 804-441-9344
 Download Databook
 Schedule a Meeting