North America Collagen Market Size is USD 3.53 Billion in 2026
North America Collagen Market (By Product: Gelatin, Hydrolysed Collagen, Native Collagen, Synthetic Collagen, Others; By Source: Bovine, Porcine, Poultry, Marine, Others; By Application: Food & Beverages, Healthcare, Cosmetics, Others) Industry Size, Share, Growth, Trends 2026 to 2035.


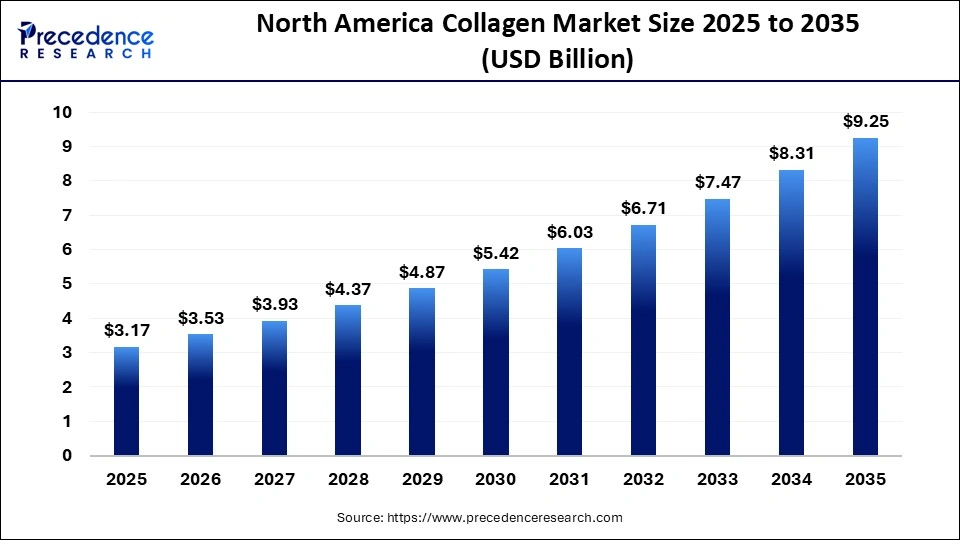
The North America collagen market size was estimated at USD 3.17 billion in 2025 and is predicted to increase from USD 3.53 billion in 2026 to approximately USD 9.25 billion by 2035, expanding at a CAGR of 11.30% from 2026 to 2035. Increasing industrial usage across nutraceuticals, functional foods, pharmaceuticals, and medical applications boosts the market.
North America Collagen Market Statical Scope
| Reports Attributes | Statistics |
| Market Size in 2025 | USD 3.17 Billion |
| Market Size in 2026 | USD 3.53 Billion |
| Market Size by 2035 | USD 9.25 Billion |
| CAGR 2026 to 2035 | 11.30% |
| Base Year | 2025 |
| Forecast Period | 2026 to 2035 |
The collagen market is a vital segment of the North American functional ingredients, healthcare, and personal care industries. Collagen, a structural protein found in connective tissues, sees widespread use across food and beverage formulations, medical applications, and cosmetic products. The rising demand for collagen is driven by health-conscious consumers, aging populations, and increased applications in preventive healthcare. Manufacturers are focusing on purity, bioavailability, and transparency regarding ingredient sources to meet changing regulatory and consumer expectations.
In the food industry, collagen enhances various products. It is used in confectionery to improve chewiness, foam stability, and texture, serves as a texturizing and stabilizing agent in dairy products , and acts as a binding agent for the ingredients in nutritional bars, improving their softness and flexibility. As a result, collagen's functionality has led to its increased use in food applications.
Over time, collagen fibers in human skin deteriorate, causing a loss of thickness and strength, which contributes to skin aging. Consequently, collagen is incorporated in cosmetic creams to support skin and bone regeneration, vascular and cardiac reconstruction, skin replacement, and other cosmetic procedures.
In North America, the collagen market is experiencing significant innovation. Many ingredient manufacturers are entering this fragmented market by developing customized collagen-based solutions to meet individual needs, alongside various partnerships, mergers, and acquisitions.
The evolving refinement of extraction and processing technologies for collagen is improving the quality and versatility of collagen products, enhancing their effectiveness across numerous end-use industries and expanding the overall scope of this fundamental protein.
North America Collagen Market Share, By Product, 2025 (%)
| Segments | Shares (%) |
| Hydrolysed Collagen | 45% |
| Gelatin | 30% |
| Native Collagen | 15% |
| Synthetic Collagen | 5% |
| Others | 5% |
- Hydrolysed Collagen - High bioavailability and widespread use in supplements and functional foods, with a 45% share, establish hydrolysed collagen as the leading product segment.
- Gelatin - Strong demand in food processing and confectionery, with a 30% share, supports the market but remains below hydrolysed collagen.
- Native Collagen - Limited use in specialized applications, with a 15% share, contributes but does not lead the market.
- Synthetic Collagen - Emerging innovation with limited adoption, with a 5% share, restricts broader market presence.
- Others - Diverse minor product types, with a 5% share, result in minimal contribution.
North America Collagen Market Share, By Source, 2025 (%)
| Segments | Shares (%) |
| Bovine | 40% |
| Marine | 25% |
| Porcine | 20% |
| Poultry | 10% |
| Others | 5% |
- Bovine - Wide availability and cost-effectiveness, with a 40% share, establish bovine as the leading collagen source.
- Marine - Growing demand for clean-label and halal-friendly products, with a 25% share, supports the market but remains below bovine dominance.
- Porcine - Strong use in traditional gelatin production, with a 20% share, contributes but does not lead.
- Poultry - Limited but growing applications, with a 10% share, restrict overall contribution.
- Others - Niche and alternative sources, with a 5% share, result in minimal market impact.
North America Collagen Market Share, By Application, 2025 (%)
| Segments | Shares (%) |
| Food & Beverages | 50% |
| Healthcare | 20% |
| Cosmetics | 20% |
| Others | 10% |
- Food & Beverages - Extensive use in functional foods, beverages, and supplements, with a 50% share, establish this as the leading application segment.
- Healthcare - Increasing use in medical and nutraceutical products, with a 20% share, supports demand but remains below food & beverages.
- Cosmetics - Strong demand in skincare and beauty products, with a 20% share, contributes significantly but does not surpass the leading segment.
- Others - Diverse smaller applications, with a 10% share, result in moderate overall contribution.
Top Companies of North America Collagen Market
- Nitta Gelatin, NA Inc.
- Weishardt
- Tessenderlo Group
- Gelita AG
- Rousselot
- PB Gelatins
- Collagen Solutions
- Gelnex
- Advanced BioMatrix
Segments Covered in the Report
By Product
- Gelatin
- Hydrolysed Collagen
- Native Collagen
- Synthetic Collagen
- Others
By Source
- Bovine
- Porcine
- Poultry
- Marine
- Others
By Application
- Food & Beverages
- Healthcare
- Cosmetics
- Others
| Product | 2025 | 2026 | 2027 | 2028 | 2029 | 2030 | 2031 | 2032 | 2033 | 2034 | 2035 |
|---|---|---|---|---|---|---|---|---|---|---|---|
| Gelatin | 0.95 | 1.06 | 1.18 | 1.31 | 1.46 | 1.62 | 1.81 | 2.01 | 2.24 | 2.49 | 2.77 |
| Hydrolysed Collagen | 1.43 | 1.59 | 1.77 | 1.97 | 2.19 | 2.44 | 2.71 | 3.02 | 3.36 | 3.74 | 4.16 |
| Native Collagen | 0.48 | 0.53 | 0.59 | 0.66 | 0.73 | 0.81 | 0.90 | 1.01 | 1.12 | 1.25 | 1.39 |
| Synthetic Collagen | 0.16 | 0.18 | 0.20 | 0.22 | 0.24 | 0.27 | 0.30 | 0.34 | 0.37 | 0.42 | 0.46 |
| Others | 0.16 | 0.18 | 0.20 | 0.22 | 0.24 | 0.27 | 0.30 | 0.34 | 0.37 | 0.42 | 0.46 |
| Source | 2025 | 2026 | 2027 | 2028 | 2029 | 2030 | 2031 | 2032 | 2033 | 2034 | 2035 |
|---|---|---|---|---|---|---|---|---|---|---|---|
| Bovine | 1.27 | 1.41 | 1.57 | 1.75 | 1.95 | 2.17 | 2.41 | 2.68 | 2.99 | 3.32 | 3.70 |
| Porcine | 0.63 | 0.71 | 0.79 | 0.87 | 0.97 | 1.08 | 1.21 | 1.34 | 1.49 | 1.66 | 1.85 |
| Poultry | 0.32 | 0.35 | 0.39 | 0.44 | 0.49 | 0.54 | 0.60 | 0.67 | 0.75 | 0.83 | 0.92 |
| Marine | 0.79 | 0.88 | 0.98 | 1.09 | 1.22 | 1.35 | 1.51 | 1.68 | 1.87 | 2.08 | 2.31 |
| Others | 0.16 | 0.18 | 0.20 | 0.22 | 0.24 | 0.27 | 0.30 | 0.34 | 0.37 | 0.42 | 0.46 |
Research Methodology
Related Databooks
March 2026
April 2026
April 2026
April 2026

 sales@precedenceresearch.com
 +1 804-441-9344
 Download Databook
 Schedule a Meeting