North America Glamping Market Market Size is USD 1,123.47 Million in 2026
North America Glamping Market (By Accommodation: Cabins & Pods, Tents, Yurts, Treehouses, Others; By Age Group: 18 - 32 years, 33 - 50 years, 51 - 65 years, Above 65 years; By Booking Mode: Direct Booking, Travel Agents, Online Travel Agencies) Industry Size, Share, Growth, Trends 2026 to 2035.


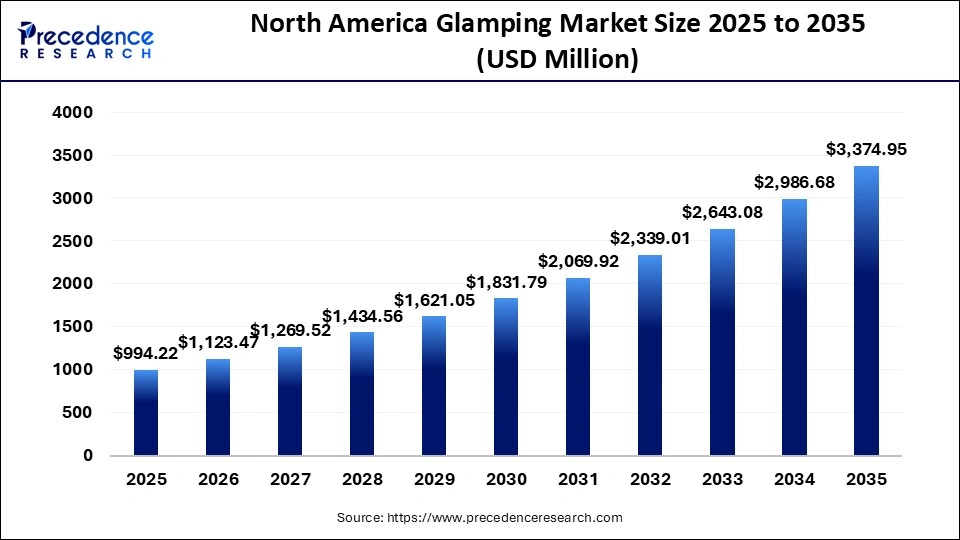
The North America glamping market size was estimated at USD 994.22 million in 2025 and is expanding at a CAGR of 13% from 2026 to 2035. The glamping market is mainly fueled by the growing interest in eco-friendly travel, luxurious nature experiences, and premium amenities.
North America Glamping Market Statical Scope
| Reports Attributes | Statistics |
| Market Size in 2025 | USD 994.22 Million |
| Market Size in 2026 | USD 1,123.47 Million |
| Market Size by 2035 | USD 3,374.95 Million |
| CAGR 2026 to 2035 | 13% |
| Base Year | 2025 |
| Forecast Period | 2026 to 2035 |
The North American glamping market is crucial as it leads the global industry by turning outdoor tourism into a luxurious, eco-friendly sector. It combines nature with comfort, like Wi-Fi and king beds, boosting the travel industry's growth by appealing to millennials, Gen Z, and families looking for unique experiences. It fulfills the need for "sustainable tourism," serving eco-conscious travelers who want luxurious stays with minimal environmental impact.
The market encourages a shift towards experiential travel instead of just places to stay, with operators noting a rise in demand for unique, personalized experiences.
The industry promotes innovation in unique lodging options, such as luxury tents, treehouses, and eco-pods, which are favored for their distinctive, "Instagrammable" appeal. It generates significant revenue opportunities by providing a "convenience-first" approach to outdoor experiences, attracting travelers who might otherwise choose traditional hotels. Numerous glamping businesses are emerging near national parks and remote locations, creating local jobs and enhancing local tourism economies.
North America Glamping Market, By Accommodation, 2025 (%)
| Segments | Shares (%) |
| Cabins & Pods | 39% |
| Tents | 26% |
| Yurts | 15% |
| Treehouses | 12% |
| Others | 8% |
- Cabins & Pods - The cabins and pods segment, with a share of 39%, is dominant in the market, holding the largest revenue share by blending nature with high-end hotel luxury. They attract mainstream tourists seeking comfort and safety year-round, regardless of the weather.
- Tents - The tents segment, with a share of 26%, is significant in the market, expected to grow as it combines nature immersion with luxury. It offers unique options like safari tents and yurts that cater to eco-conscious travelers looking for comfortable and 'Instagrammable' outdoor experiences.
- Yurts - The yurts segment, with a share of 15%, is key to the market, merging rustic nature experiences with modern luxury for a unique 'Instagram-worthy' appeal that attracts millennials. Their versatility, durable design, and easy setup make them popular year-round.
- Treehouses - The treehouse segment, with a share of 12%, is essential in the market, driven by demand for unique, eco-friendly accommodations. It combines adventure with luxury, appealing to younger travelers seeking 'off-grid' experiences that are ideal for social media, generating high engagement and revenue.
- Others -
North America Glamping Market, By Age Group, 2025 (%)
| Segments | Shares (%) |
| 18 - 32 years | 45% |
| 33 - 50 years | 28% |
| 51 - 65 years | 65% |
| Above 65 years | 9% |
- 18 - 32 years - The 18 - 32 age group, with a share of 45%, is crucial for the glamping market, contributing the highest to revenue. This demographic, comprising millennials and Gen Z, is transforming the industry towards luxury-nature experiences, prioritizing unique, Instagram-friendly, and eco-conscious travel over material possessions.
- 33 - 50 years - The 33 - 50 age group, with a share of 28%, plays a key role in the market, consisting of high-spending professionals and families seeking premium, nature-focused experiences. They enhance revenue by opting for 'comfort-first' adventures and favor Instagram-worthy, eco-friendly luxury accommodations with upscale amenities.
- 51 - 65 years - The 51 to 65 age group, with a share of 18%, is significant in the market due to their high disposable income and preference for comfortable, nature-based travel that is less physically demanding than traditional camping.
- Above 65 years - The over 65 segment, with a share of 9%, is increasingly important in the glamping market, as this group seeks accessible, comfortable, and safe nature-based travel experiences rather than the raw adventures favored by younger consumers.
North America Glamping Market, By Booking Mode, 2025 (%)
| Segments | Shares (%) |
| Direct Booking | 51% |
| Travel Agents | 20% |
| Online Travel Agencies | 29% |
- Direct Booking - Direct booking, with a share of 51%, is dominant in the market, as it secures the largest revenue share, boosts profit margins by eliminating third-party fees, and fosters guest loyalty. It enables personalized service, tailored packages, and better control over property availability.
- Travel Agents - Travel agents, with a share of 20%, are essential in the North American glamping market, linking premium, remote experiential travel with consumers seeking curated luxury in nature.
- Online Travel Agencies - The OTA segment, with a share of 29%, is vital in the market, driving visibility, booking ease, and market growth, and accounting for a significant share of bookings. OTAs allow consumers to compare unique, upscale, eco-friendly lodging options while offering seamless mobile booking and instant confirmation, appealing to tech-savvy, younger, affluent travelers.
Top Companies in the North America Glamping Market
- THE LAST BEST BEEF LLC (The Resort at Paws Up)
- Conestoga Ranch
- Capitol Reef Resort
- Ventana Big Sur, an Alila Resort
- Westgate Resorts (Westgate River Ranch)
- LITTLE ARROW OUTDOOR RESORT
- Huttopia Adirondacks
- The Griffin Ranch
- Dunton Hot Springs
- Under Canvas
- VILLAGE CAMP
Segments Covered in the Report
By Accommodation
- Cabins & Pods
- Tents
- Yurts
- Treehouses
- Others
By Age Group
- 18 - 32 years
- 33 - 50 years
- 51 - 65 years
- Above 65 years
By Booking Mode
- Direct Booking
- Travel Agents
- Online Travel Agencies
| Age Group | 2025 | 2026 | 2027 | 2028 | 2029 | 2030 | 2031 | 2032 | 2033 | 2034 | 2035 |
|---|---|---|---|---|---|---|---|---|---|---|---|
| 18-32 | 278.38 | 316.82 | 361.81 | 411.72 | 468.48 | 534.88 | 610.92 | 697.95 | 794.88 | 914.10 | 1051.10 |
| 33-50 | 238.61 | 271.88 | 311.03 | 354.33 | 403.64 | 461.61 | 528.08 | 604.27 | 688.90 | 788.22 | 881.57 |
| 51-65 | 318.15 | 353.89 | 393.55 | 437.54 | 486.31 | 540.38 | 600.56 | 667.51 | 741.89 | 824.19 | 915.48 |
| Above 65 | 159.08 | 180.88 | 203.12 | 230.96 | 262.61 | 294.92 | 331.35 | 372.40 | 423.94 | 470.54 | 542.51 |
| Booking Mode | 2025 | 2026 | 2027 | 2028 | 2029 | 2030 | 2031 | 2032 | 2033 | 2034 | 2035 |
|---|---|---|---|---|---|---|---|---|---|---|---|
| Direct Booking | 507.05 | 567.35 | 634.76 | 710.10 | 794.31 | 888.41 | 994.04 | 1112.51 | 1245.31 | 1393.63 | 1559.70 |
| Travel Agents | 188.90 | 207.84 | 228.51 | 251.05 | 275.58 | 302.24 | 331.35 | 363.03 | 397.44 | 434.57 | 474.69 |
| Online Travel Agencies | 298.27 | 348.28 | 406.25 | 473.40 | 551.15 | 641.12 | 745.53 | 866.59 | 1006.85 | 1168.85 | 1356.26 |
Research Methodology
Related Databooks
April 2026
April 2026
April 2026
April 2026

 sales@precedenceresearch.com
 +1 804-441-9344
 Download Databook
 Schedule a Meeting