Saudi Arabia Masterbatch Market Size is USD 249.94 Million in 2026
Saudi Arabia Masterbatch Market (By Product (Oxo-Biodegradable Masterbatch, White Masterbatch, Black Masterbatch, Color Masterbatch, Additives, Filler); By Carrier Polymer (Polypropylene (PP), Polyethylene (PE), Polyvinyl Chloride (PVC), Polyethylene Terephthalate (PET), Others); By Application (Packaging, Building & Construction, Consumer Goods, Automotive, Agriculture)) Industry Size, Share, Growth, Trends 2026 to 2035.


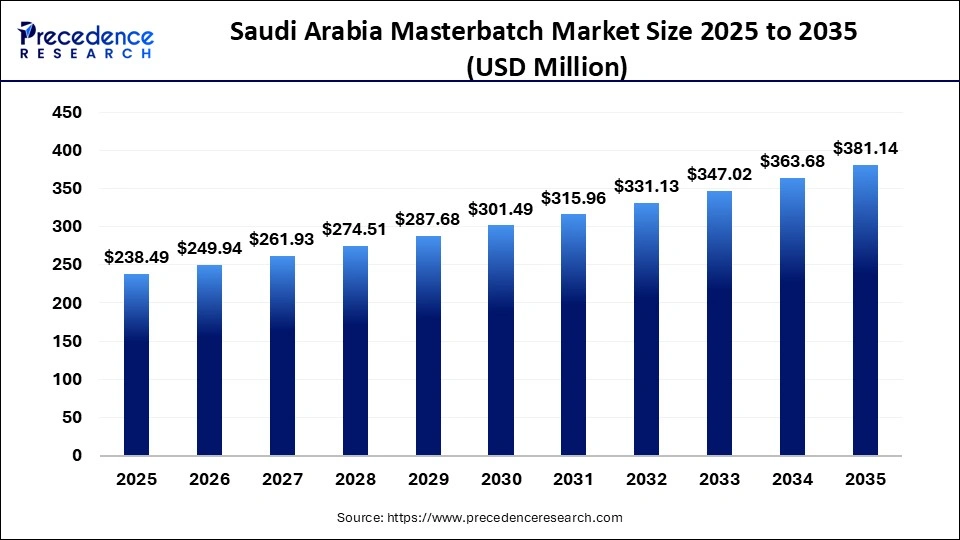
The Saudi Arabia masterbatch market size was estimated at USD 238.49 million in 2025 and is expanding at a CAGR of 4.80% from 2026 to 2035. Growing demand for plastic components, fibers, and color polymers in sectors such as the automotive, construction, agriculture, and packaging industries.
Saudi Arabia Masterbatch Market Statical Scope
| Reports Attributes | Statistics |
| Market Size in 2025 | USD 238.49 Million |
| Market Size in 2026 | USD 249.94 Million |
| Market Size by 2035 | USD 381.14 Million |
| CAGR 2026 to 2035 | 4.8% |
| Base Year | 2025 |
| Forecast Period | 2026 to 2035 |
Masterbatch refers to a solid or liquid additive used to impart certain properties to plastics, as well as to provide color or shade. Colored masterbatch can convey characteristics such as energy efficiency, effects, UV stabilization, biodegradability, and antioxidant properties.
In Saudi Arabia, producers are rapidly adopting high-recycled-content masterbatches in line with the sustainability targets set by Vision 2030. The swift expansion of the automotive sector in the country is a key driver of rising demand for high-performance masterbatches, particularly for electric vehicle components that require flame retardancy, UV stability, and vibrant coloration.
The demand for colored plastics is also growing rapidly, driven by an expanding packaging industry. This sector is witnessing significant growth in Saudi Arabia, fueled by the combined development of various sub-segments, including food, industrial, retail, consumer, and medical packaging films .
Saudi Arabia Masterbatch Market Share, By Product, 2025, (%)
| Segments | Shares (%) |
| White Masterbatch | 22% |
| Color Masterbatch | 20% |
| Black Masterbatch | 18% |
| Additives | 17% |
| Oxo-Biodegradable Masterbatch | 8% |
| Filler | 15% |
- White masterbatch- It dominates because of strong demand in packaging and consumer goods for opacity and brightness, contributing a 22% share in the market.
- Color masterbatch- this segment is growing rapidly, holding 20% share, as it offers color, aesthetics, and specialized properties and is widely used for aesthetic customization.
- Black masterbatch- It provides improved UV stability and is suitable for outdoor applications, like agricultural films and automotive films and accounts for 18% share.
- Additives- demand for high-performance materials in various sectors is increasing the demand for additives with 17% share.
Saudi Arabia Masterbatch Market Share, By Carrier Polymer, 2025, (%)
| Segments | Shares (%) |
| Polypropylene (PP) | 30% |
| Polyethylene (PE) | 28.% |
| Polyvinyl Chloride (PVC) | 18% |
| Polyethylene Terephthalate (PET) | 14% |
| Others | 10% |
- Polypropylene- It holds the largest share of 30% because of its versatility, cost-effectiveness, and wide use in packaging and automotive sectors.
- Polyethylene- It is widely used in films, packaging, geosynthetics , industrial films, refuse bags, and lamination and holds 28% share.
- Polyvinyl chloride (PVC)- the country's robust construction sector, with strong demand for pipes, profiles, and flooring is driving the growth with 18% share.
- Polyethylene terephthalate (PET)- demand for UV-resistant plastics and high-quality finishes specifically demands PET carrier resins with 14% share.
Saudi Arabia Masterbatch Market Share, By Application, 2025, (%)
| Segments | Shares (%) |
| Packaging | 34% |
| Building & Construction | 20% |
| Consumer Goods | 16% |
| Automotive | 10% |
| Others | 8% |
- Packaging- It leads due to high demand for plastic packaging solutions across industries, holding a 34% share in the market.
- Building and construction- rapid urbanization and investment in projects like NEOM are boosting the segment growth with 20% share.
- Consumer goods- increasing fast-moving consumer goods and shifting consumer lifestyles, boosting the growth with 16% share.
- Automotive- the automotive segment holds 10% share due to demand for lightweight materials.
Top Companies in the Saudi Arabia Masterbatch Market
- Avient Corporation
- Astra Polymer Compounding Co., Ltd.
- Cabot Corporation
- Ingenia Polymer Corp.
- Ampacet Corporation
- Juffali PolyOne Master Batches Co. Ltd.
- MD International Masterbatch & Compound
- Pure Polymers
- Rifd Plastics
Segments Covered in the Report
By Product
- Oxo-Biodegradable Masterbatch
- White Masterbatch
- Black Masterbatch
- Color Masterbatch
- Additives
- Filler
By Carrier Polymer
- Polypropylene (PP)
- Polyethylene (PE)
- Polyvinyl Chloride (PVC)
- Polyethylene Terephthalate (PET)
- Others
By Application
- Packaging
- Building & Construction
- Consumer Goods
- Automotive
- Agriculture
| Carrier Polymer | 2025 | 2026 | 2027 | 2028 | 2029 | 2030 | 2031 | 2032 | 2033 | 2034 | 2035 |
|---|---|---|---|---|---|---|---|---|---|---|---|
| PP | 71.55 | 74.96 | 78.56 | 82.34 | 86.32 | 90.47 | 94.80 | 99.31 | 103.98 | 108.82 | 113.82 |
| PE | 59.62 | 62.46 | 65.46 | 68.63 | 71.95 | 75.43 | 79.08 | 82.90 | 86.88 | 91.03 | 95.35 |
| PVC | 35.77 | 37.48 | 39.28 | 41.17 | 43.16 | 45.25 | 47.43 | 49.70 | 52.07 | 54.54 | 57.10 |
| PET | 23.85 | 25.09 | 26.19 | 27.45 | 28.78 | 30.18 | 31.66 | 33.21 | 34.83 | 36.54 | 38.34 |
| Others | 47.70 | 49.84 | 52.38 | 55.09 | 58.00 | 61.05 | 64.61 | 67.95 | 71.58 | 75.50 | 79.70 |
| Total | 238.49 | 249.85 | 261.85 | 274.50 | 287.83 | 301.84 | 316.58 | 332.06 | 348.33 | 365.42 | 383.35 |
| Application | 2025 | 2026 | 2027 | 2028 | 2029 | 2030 | 2031 | 2032 | 2033 | 2034 | 2035 |
|---|---|---|---|---|---|---|---|---|---|---|---|
| Packaging | 95.40 | 99.94 | 104.74 | 109.80 | 115.12 | 120.71 | 126.57 | 132.70 | 139.11 | 145.80 | 152.77 |
| Building & Construction | 47.70 | 50.00 | 52.37 | 54.90 | 57.58 | 60.42 | 63.42 | 66.59 | 69.91 | 73.41 | 77.09 |
| Consumer Goods | 35.77 | 37.48 | 39.28 | 41.18 | 43.17 | 45.25 | 47.43 | 49.70 | 52.07 | 54.54 | 57.10 |
| Automotive | 35.77 | 37.48 | 39.28 | 41.18 | 43.17 | 45.25 | 47.43 | 49.70 | 52.07 | 54.54 | 57.10 |
| Agriculture | 23.85 | 24.95 | 26.18 | 27.45 | 28.78 | 30.18 | 31.74 | 33.37 | 34.62 | 36.14 | 38.30 |
| Total | 238.49 | 249.85 | 261.85 | 274.50 | 287.83 | 301.84 | 316.58 | 332.06 | 348.33 | 365.42 | 383.35 |
Research Methodology
Related Databooks
March 2026
March 2026
April 2026
April 2026

 sales@precedenceresearch.com
 +1 804-441-9344
 Download Databook
 Schedule a Meeting